<< Chapter < Page Chapter >> Page >

Social sciences

Geography

Map work

Grade 9

Module 13

Magnetic north map skills

You became acquainted with basic map skills in Grade 8 and did exercises that involved the 1:50 000 topographic map of Alice. In doing that, you learned to:

determine location

gauge accurately and determine direction

calculate distance by making use of a scale

explain the naming of a map

recognise conventional map symbols

recognise representation of height on maps

identify contour patterns

This knowledge, together with what you will still be acquiring in using the 1:50 000 topographic map of Bloemfontein and a 1:10 000 orthophoto map of a portion of this will see you through this year’s work.

Before commencing the practical exercises, you have to learn a number of additional map skills.

Calculating distance on an orthophoto map.

Orthophoto maps are always drawn to the scale of 1:10 000. Follow the steps to determine distance:

Accurately measure the distance between two points in centimetres, using a ruler (or using a string if the line to be measured curves);

Convert this distance to kilometres or metres, depending on what is required.

Example

A________________________________B

The length between A and B is 10 cm.

Scale 1 1:10 000

What is the true distance in km?

10 cm x 10 000

100 000 cm ÷ 100 000

1 km

What is the true distance in m?

10 cm x 10 000

100 000 ÷ 100

1000 m

Why do we divide by 100 000 and 100?

The metrical units of measurement can be represented as follows:

Km Hm Dm M dm cm mm
1 0 0 0 0 0
1 0 0

We therefore have 100 000 cm in 1 km

and

100 cm in 1 meter

You may therefore follow the shorter method if you can remember that the scale of

1 : 10 000 is the same as:

1 cm = 10 000 cm

1 cm = 100 m (÷ 100)

1 cm = 0,1 km (÷ 100 000)

Activity 1: [lo 1.3]

  1. Calculate the true distance in metres if the distance on a 1:10 000 orthophoto map is as follows;
  1. 5,8 cm.
  2. 10,1 cm.
  3. Calculate the true distance in kilometres if the distance on a 1:10 000 orthophoto map is as follows;
  1. 92,2 cm.
  2. 15,6 cm. Magnetic North and Magnetic Declination

You have learnt how to gauge accurately in Grade 8. Remember the steps that have to be followed:

Connect the two points by means of a pencilled line.

  • Draw a line to show True North through the point FROM which you have to measure.
  • Position the protractor by placing 0° against the line indicating north and the centre at the point from which the measurement is to be taken.
  • Measure the angle clockwise from the line for north to the connecting line (pencilled line of Step 1.)

Example:

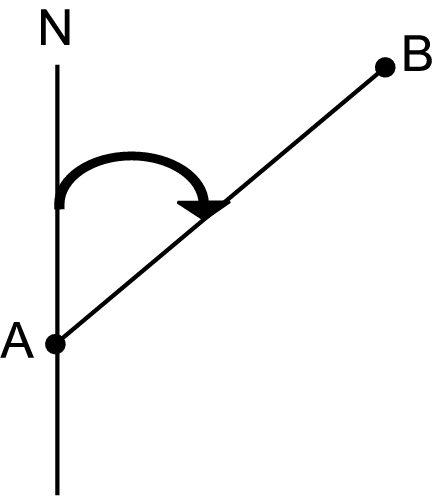
On a map, North therefore indicates the North Pole, which we refer to as TRUE NORTH (geographic north.)

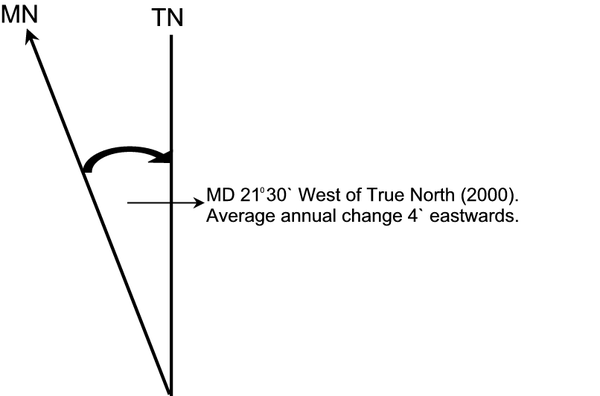
The earth also has a magnetic field that extends from north to south, for which we use a compass. The earth’s magnetic field does not correspond exactly with the true North and South Poles. North as indicated by the compass will always lie WEST of TRUE NORTH (TN) and is known as MAGNETIC NORTH (MN).

The difference between true north and magnetic north is known as the MAGNETIC DECLINATION (MD). The Magnetic Declination differs from place to place and continuously increases and decreases at any place, because magnetic north is not a fixed point.

To make it possible to determine the Magnetic Declination of any place, the following information is given in the margin of a 1:50 000 topographic map:

Example:

Calculate magnetic declination as at present:

Step 1:

Calculate the difference in years = 2003 – 2000

= 3 years

Step 2:

Multiply the years by the annual difference in minutes = 3 years x 4'

= 12'

Step 3:

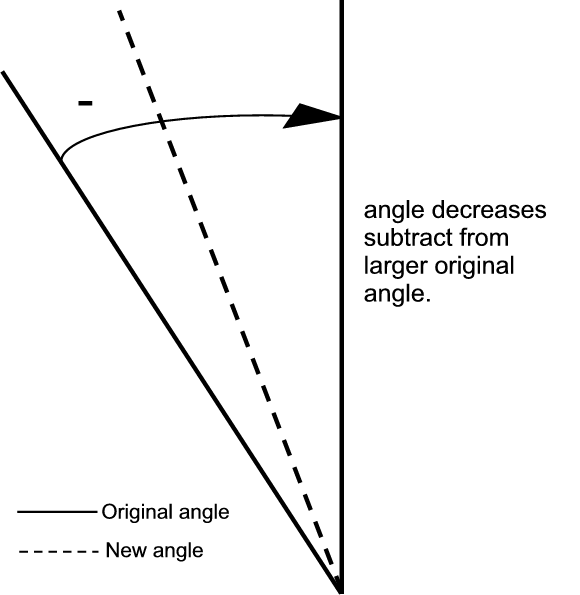
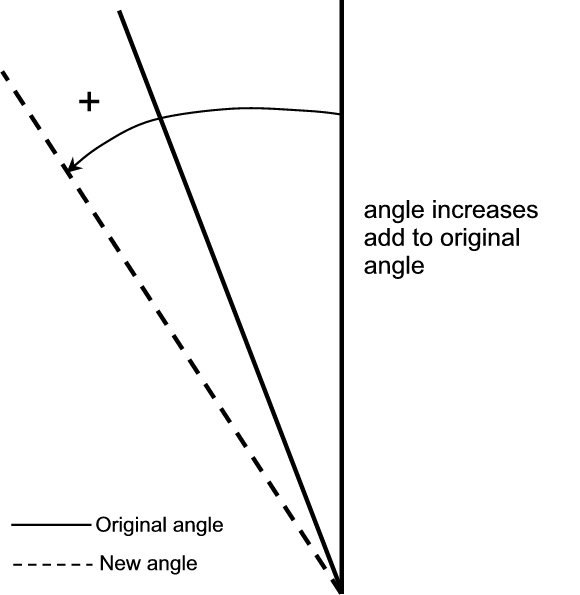
Determine whether the angle increases (eastwards) or decreases (westwards).

Eastwards (smaller) -

Westwards (bigger) +

Step 4:

Add the minutes (westwards) or subtract them (eastwards).

In this instance it is eastwards, therefore:

21°30' - 12'

= 21°18' West of True North

REMEMBER that there are 60' in 1°.

If you should have to subtract and find that the degrees to be subtracted are too many, you “borrow” 1° and convert it to minutes.

Example:

21°30' – 34'

20°90' - 34'

= 20°56' West of True North.

If you should have to add minutes and get an answer that is more than 60’, you have to convert it 1°.

Example:

21°30' + 34'

21°64'

= 22°04' West of True North.

Step 5:

Remember to write West of True North alongside the new declination, because Magnetic North ALWAYS lies WEST of True NORTH.

Magnetic North

To gauge Magnetic North between two points, the degrees of TRUE NORTH must be added (+) to the Magnetic Declination and the answer must be written in degrees:

Example:

TN + MD = MN

50° + 21°18' = 71°18'

Assessment

Learning Outcomes(LOs)
LO 1
Geographical EnquiryThe learner will be able to use enquiry skills to investigate geographical and environmental concepts and processes.
Assessment Standards(ASs)
We know this when the learner:
1.2 asks questions that are relevant for identifying sources;
1.3 draws conclusions and makes analyses to obtain information from sources such as photographs, maps, atlases, graphs and statistics;
1.4 correlates information from different sources;
1.7 reports on knowledge that they have obtained through research, making use of different sources of information.
LO 2
Geographical Knowledge and UnderstandingThe learner will be able to demonstrate geographical and environmental knowledge and understanding.
We know this when the learner:
2.2 identifies ways in which Science and Technology have contributed a positively and negatively influence to development (people and resources.)

Memorandum

ACTIVITY1:

  • 580 m
  • 1 010 m
  • 9,22 km
  • 1,56 km

ACTIVITY2:

1. True North / Bearing :

Magnetic Declination:

1990 – 2003 = 13 years

13 × 2’ = 26’ westwards

18 0 41’ + 26’ (westwards)

= 18 0 67’

= 19 0 07 west of true north

Magnetic Bearing: WN + MD = MN

…… + 19 0 07 = ………………………..

  1. Actual Bearing :

Magnetic Declination: 1993 – 2003 = 10 years

10 × 3’ = 30’ eastwards (-)

20 0 15’ – 30’

19 0 75 – 30

= 19 0 45’ west of true north

Magnetic Bearing: WN + MO = MN

...................... + 19 0 45 =..................................

Questions & Answers

differentiate between demand and supply giving examples
Lambiv Reply
differentiated between demand and supply using examples
Lambiv
what is labour ?
Lambiv
how will I do?
Venny Reply
how is the graph works?I don't fully understand
Rezat Reply
information
Eliyee
devaluation
Eliyee
t
WARKISA
hi guys good evening to all
Lambiv
multiple choice question
Aster Reply
appreciation
Eliyee
explain perfect market
Lindiwe Reply
In economics, a perfect market refers to a theoretical construct where all participants have perfect information, goods are homogenous, there are no barriers to entry or exit, and prices are determined solely by supply and demand. It's an idealized model used for analysis,
Ezea
What is ceteris paribus?
Shukri Reply
other things being equal
AI-Robot
When MP₁ becomes negative, TP start to decline. Extuples Suppose that the short-run production function of certain cut-flower firm is given by: Q=4KL-0.6K2 - 0.112 • Where is quantity of cut flower produced, I is labour input and K is fixed capital input (K-5). Determine the average product of lab
Kelo
Extuples Suppose that the short-run production function of certain cut-flower firm is given by: Q=4KL-0.6K2 - 0.112 • Where is quantity of cut flower produced, I is labour input and K is fixed capital input (K-5). Determine the average product of labour (APL) and marginal product of labour (MPL)
Kelo
yes,thank you
Shukri
Can I ask you other question?
Shukri
what is monopoly mean?
Habtamu Reply
What is different between quantity demand and demand?
Shukri Reply
Quantity demanded refers to the specific amount of a good or service that consumers are willing and able to purchase at a give price and within a specific time period. Demand, on the other hand, is a broader concept that encompasses the entire relationship between price and quantity demanded
Ezea
ok
Shukri
how do you save a country economic situation when it's falling apart
Lilia Reply
what is the difference between economic growth and development
Fiker Reply
Economic growth as an increase in the production and consumption of goods and services within an economy.but Economic development as a broader concept that encompasses not only economic growth but also social & human well being.
Shukri
production function means
Jabir
What do you think is more important to focus on when considering inequality ?
Abdisa Reply
any question about economics?
Awais Reply
sir...I just want to ask one question... Define the term contract curve? if you are free please help me to find this answer 🙏
Asui
it is a curve that we get after connecting the pareto optimal combinations of two consumers after their mutually beneficial trade offs
Awais
thank you so much 👍 sir
Asui
In economics, the contract curve refers to the set of points in an Edgeworth box diagram where both parties involved in a trade cannot be made better off without making one of them worse off. It represents the Pareto efficient allocations of goods between two individuals or entities, where neither p
Cornelius
In economics, the contract curve refers to the set of points in an Edgeworth box diagram where both parties involved in a trade cannot be made better off without making one of them worse off. It represents the Pareto efficient allocations of goods between two individuals or entities,
Cornelius
Suppose a consumer consuming two commodities X and Y has The following utility function u=X0.4 Y0.6. If the price of the X and Y are 2 and 3 respectively and income Constraint is birr 50. A,Calculate quantities of x and y which maximize utility. B,Calculate value of Lagrange multiplier. C,Calculate quantities of X and Y consumed with a given price. D,alculate optimum level of output .
Feyisa Reply
Answer
Feyisa
c
Jabir
the market for lemon has 10 potential consumers, each having an individual demand curve p=101-10Qi, where p is price in dollar's per cup and Qi is the number of cups demanded per week by the i th consumer.Find the market demand curve using algebra. Draw an individual demand curve and the market dema
Gsbwnw Reply
suppose the production function is given by ( L, K)=L¼K¾.assuming capital is fixed find APL and MPL. consider the following short run production function:Q=6L²-0.4L³ a) find the value of L that maximizes output b)find the value of L that maximizes marginal product
Abdureman
types of unemployment
Yomi Reply
What is the difference between perfect competition and monopolistic competition?
Mohammed
Got questions? Join the online conversation and get instant answers!
Jobilize.com Reply

Get Jobilize Job Search Mobile App in your pocket Now!

Get it on Google Play Download on the App Store Now


Source:  OpenStax, Geography grade 9. OpenStax CNX. Sep 14, 2009 Download for free at http://cnx.org/content/col11057/1.1
Google Play and the Google Play logo are trademarks of Google Inc.

Notification Switch

Would you like to follow the 'Geography grade 9' conversation and receive update notifications?

Ask