

| << Chapter < Page | Chapter >> Page > |
We can represent the information we collect in a wide variety of ways, such as block graphs, bar graphs, line graphs, pictographs and pie graphs.
Let us have a look at a number of examples:
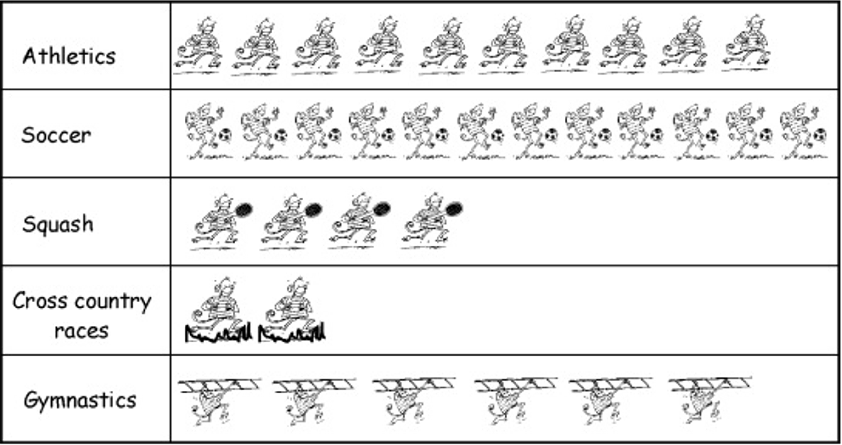
Pictogram
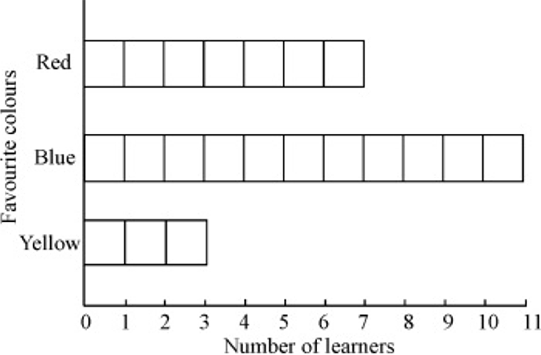
A horizontal block graph
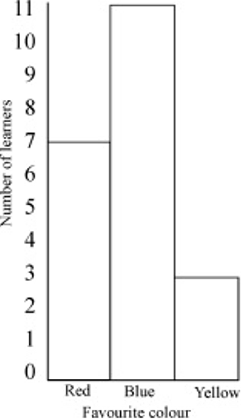
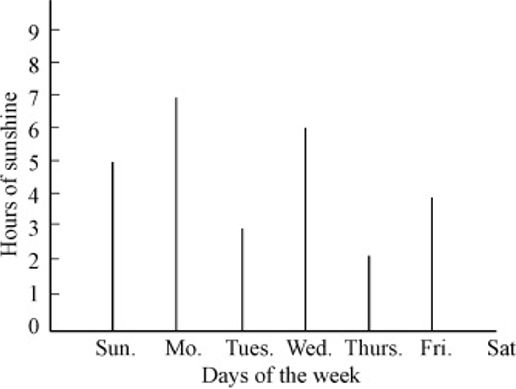
A vertical bar graph
1. Now choose one of these graphs and present the information collected in the previous module neatly.

Assessment: Graph
| Criteria | 1 | 2 | 3 | 4 |
| Axis | No axis has a caption. | Only one axis has a caption. | Both axes have captions but not correctly. | Both axes have correct and neat captions. |
| Graph | Interpretation almost impossible. | Interpretation difficult and the data is unorganised. | Graph can be interpreted but is not 100% correct. | The graph is organised and data presented meaningfully. Easy to interpret. |
| Neatness | Work is untidy and unorganised. | Organised but difficult to read. | Neat, organised and easy to read. | Neat, clearly set out and very easy to read. |
Learning Outcome 5: The learner will be able to collect, summarise, display and critically analyse data in order to draw conclusions and make predictions, and to interpret and determine chance variation.
Assessment Standard 5.6: We know this when the learner draws a variety of graphs by hand/technology to display and interpret data (grouped and ungrouped).
Notification Switch
Would you like to follow the 'Mathematics grade 6' conversation and receive update notifications?

|
|

|
|

|
|

|
|

|
|

|
|

|
|

|
|

|
|

|