This module allows students to explore concepts related to discrete random variables through the use of a simple playing card experiment. Students will compare empirical data to a theoretical distribution to determine if the experiment fist a discrete distribution. This lab involves the concept of long-term probabilities.
Class Time:
Names:
Student learning outcomes:
The student will compare empirical data and a theoretical distribution to determine if everyday experiment fits a discrete distribution.
The student will demonstrate an understanding of long-term probabilities.
Supplies:
One full deck of playing cards
Procedure
The experiment procedure is to pick one card from a deck of shuffled cards.
The theorectical probability of picking a diamond from a deck is:
Shuffle a deck of cards.
Pick one card from it.
Record whether it was a diamond or not a diamond.
Put the card back and reshuffle.
Do this a total of 10 times
Record the number of diamonds picked.
Let
number of diamonds. Theoretically,
~
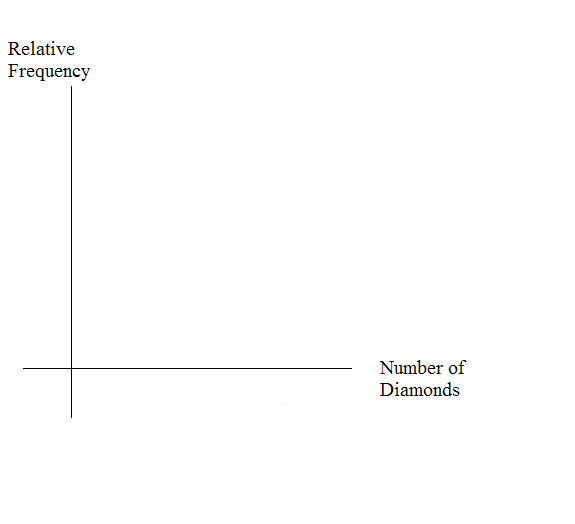
Organize the data
Record the number of diamonds picked for your class in the chart below. Then calculate the
relative frequency.
x
Frequency
Relative Frequency
0
__________
__________
1
__________
__________
2
__________
__________
3
__________
__________
4
__________
__________
5
__________
__________
6
__________
__________
7
__________
__________
8
__________
__________
9
__________
__________
10
__________
__________
Calculate the following:
=
=
Construct a histogram of the empirical data.
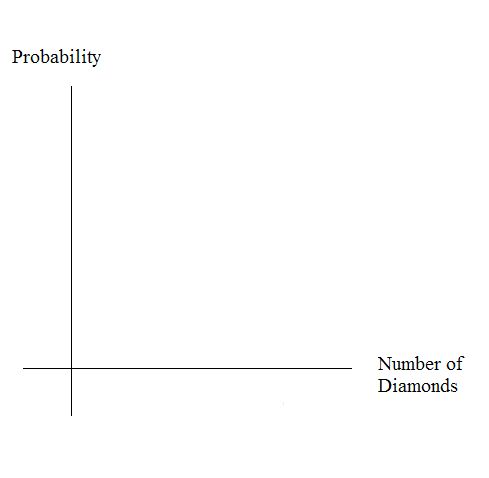
Theoretical distribution
Build the theoretical PDF chart based on the distribution in the Procedure section above.
0
1
2
3
4
5
6
7
8
9
10
Calculate the following:
Construct a histogram of the theoretical distribution.
Using the data
Calculate the following, rounding to 4 decimal places:
RF = relative frequency
Use the table from the section titled "Theoretical Distribution" here:
Use the data from the section titled "Organize the Data" here:
Discussion questions
For questions 1. and 2., think about the shapes of the two graphs, the probabilities and the relative frequencies, the means, and the standard deviations.
Knowing that data vary, describe three similarities between the graphs and distributions of
the theoretical and empirical distributions. Use complete sentences. (Note: These answersmay vary and still be correct.)
Describe the three most significant differences between the graphs or distributions of the
theoretical and empirical distributions. (Note: These answers may vary and still becorrect.)
Using your answers from the two previous questions, does it appear that the data fit the theoretical distribution? In 1 - 3 complete sentences,
explain why or why not.
Suppose that the experiment had been repeated 500 times. Which table (from "Organize the data" and "Theoretical Distributions") would you expect to change (and how would it change)? Why? Why wouldn’t the other table change?
the study of living organisms and their interactions with one another and their environment.
Wine
discuss the biological phenomenon and provide pieces of evidence to show that it was responsible for the formation of eukaryotic organelles in an essay form
advantage of electronic microscope is easily and clearly while disadvantage is dangerous because its electronic. advantage of light microscope is savely and naturally by sun while disadvantage is not easily,means its not sharp and not clear
Abdullahi
cell theory state that every organisms composed of one or more cell,cell is the basic unit of life
Abdullahi
is like gone fail us
DENG
cells is the basic structure and functions of all living things
A scanning electron microscope (SEM) is ideal for situations requiring high-resolution imaging of surfaces. It is commonly used in materials science, biology, and geology to examine the topography and composition of samples at a nanoscale level. SEM is particularly useful for studying fine details,
Hilary
Got questions? Join the online conversation and get instant answers!