<< Chapter < Page Chapter >> Page >
Basic directions on how to use Google Spreadsheet and Excel to explore and summarize bivariate data.

Displaying bivariate data in graphs

In this section we will discuss techniques using a spreadsheet for displaying quantitative data using stemplots, histograms, boxplots and qualitative data using bar graphs and pie charts. We will primarily use Microsoft Excel and Google Spreadsheet, as we will use these two resources for sampling and surveying in this introductory course.

Categorical- categorical

We will review a few techniques that you will use to create, copy, and paste into a document, and save your displays of data.

Contingency Tables: Excel - We will use pivot tables to create contingency tables. We have used them before for univariate data. This time we will highlight two columns of data to create our pivot tables. Both columns of data must be categorical. The two columns of data must be side-by-side. A good technique to use is to copy the two columns of data you want to display in a contingency table to a new labeled worksheet, side by side. The example below demonstrates that process.

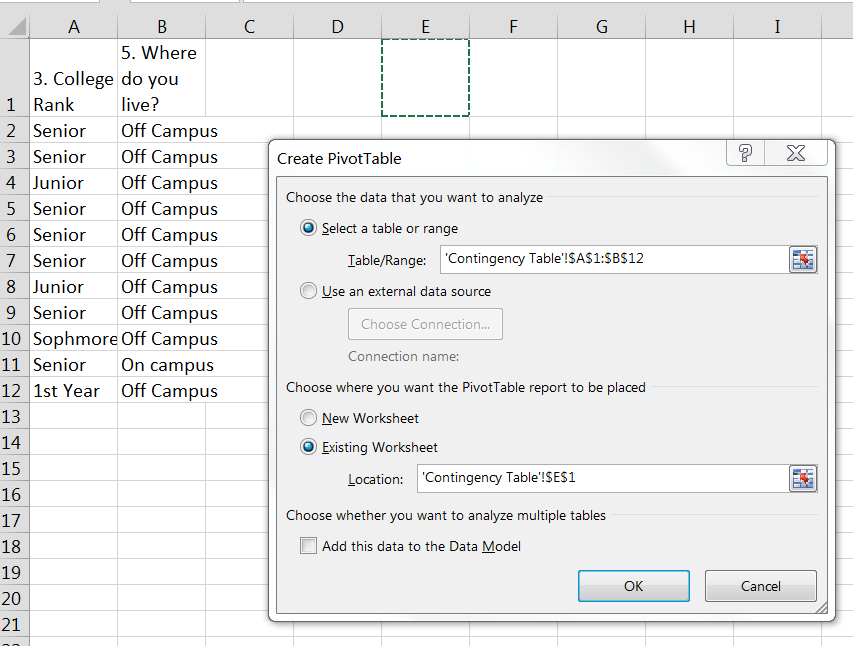
I have two columns of data in a new worksheet labeled. When I mouse over the OK button, and click, the PivotTable Fields will appear and I can use them to create a contingency table. I usually select the variable with the least number of “categories” for the columns and the variable with the largest number of “categories” for the rows. This just makes the chart easier to cut and paste into a word document. In the example below I have dragged and dropped “Where do you live?” to the “Columns” field and “College Rank” to the “Rows” field. I can then either put college rank or where do you live in the “Values” field. For this example I put college rank into the values field. I now have a contingency table. See image below. I have only the “counts” in my contingency table. The next step will be to create row or column percents.

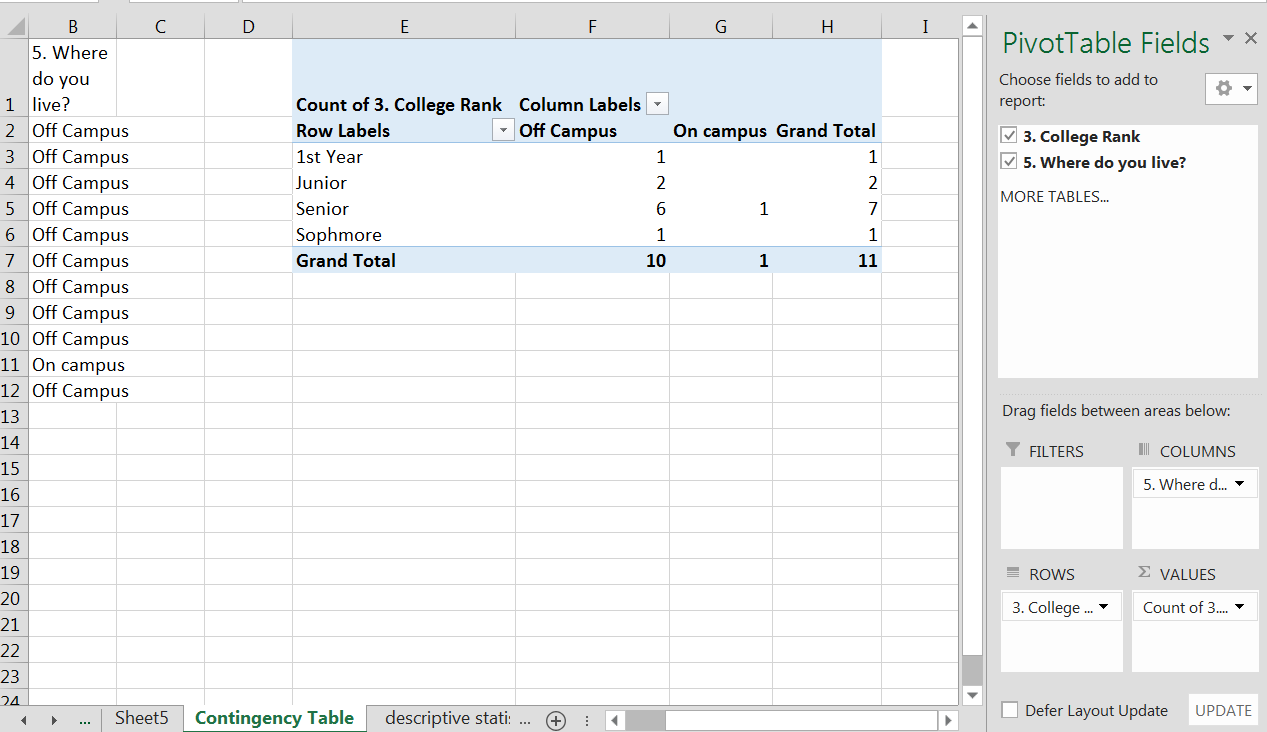
I can now add another “college rank” to the “Values” field to create a percent field. I now have two “college rank” fields in my “Values” field. I will create percentages for either row or columns by clicking on the down arrow next to the count of “college rank” and picking “Value field setting” from the drop-down menu. When I pick “value field settings” a pop-up menu will appear and you will select the tab that says “Show Values As”, and then from the drop-down menu of “Show Values As”, select percent of column or percent of rows. For this example I have picked “percent of column” since my data is mostly off campus. I can now see that 60 percent of the students from this sample that live off campus are seniors. I can use the percents to interpret my data. Note that when I created the second “Values” field, a “Value” field was created in the “Columns” field. You don’t create this field, the Excel spreadsheet did that automatically from you creation in the “Values” field. See image below. Also note that I highlighted my titles on the actual PivotTable and then from the home tab selected “wrap text” to make my columns neater. You can experiment with other editing of the titles to get the “look” you want.

Questions & Answers

it is the relatively stable flow of income
Chidubem Reply
what is circular flow of income
Divine Reply
branches of macroeconomics
SHEDRACK Reply
what is Flexible exchang rate?
poudel Reply
is gdp a reliable measurement of wealth
Atega Reply
introduction to econometrics
Husseini Reply
Hi
mostafa
hi
LEMLEM
hello
Sammol
hi
Mahesh
bi
Ruqayat
hi
Ruqayat
Hi fellas
Nyawa
hey
Sammol
hi
God
hello
Jahara
Good morning
Jorge
hi
abubakar
hi
Nmesoma
hi
Mahesh
Hi
Tom
Why is unemployment rate never zero at full employment?
Priyanka Reply
bcoz of existence of frictional unemployment in our economy.
Umashankar
what is flexible exchang rate?
poudel
due to existence of the pple with disabilities
Abdulraufu
the demand of a good rises, causing the demand for another good to fall
Rushawn Reply
is it possible to leave every good at the same level
Joseph
I don't think so. because check it, if the demand for chicken increases, people will no longer consume fish like they used to causing a fall in the demand for fish
Anuolu
is not really possible to let the value of a goods to be same at the same time.....
Salome
Suppose the inflation rate is 6%, does it mean that all the goods you purchase will cost 6% more than previous year? Provide with reasoning.
Geetha Reply
Not necessarily. To measure the inflation rate economists normally use an averaged price index of a basket of certain goods. So if you purchase goods included in the basket, you will notice that you pay 6% more, otherwise not necessarily.
Waeth
discus major problems of macroeconomics
Alii Reply
what is the problem of macroeconomics
Yoal
Economic growth Stable prices and low unemployment
Ephraim
explain inflationcause and itis degre
Miresa Reply
what is inflation
Getu
increase in general price levels
WEETO
Good day How do I calculate this question: C= 100+5yd G= 2000 T= 2000 I(planned)=200. Suppose the actual output is 3000. What is the level of planned expenditures at this level of output?
Chisomo Reply
how to calculate actual output?
Chisomo
how to calculate the equilibrium income
Beshir
Criteria for determining money supply
Thapase Reply
who we can define macroeconomics in one line
Muhammad
Aggregate demand
Mohammed
C=k100 +9y and i=k50.calculate the equilibrium level of output
Mercy Reply
Hi
Isiaka
Hi
Geli
hy
Man
👋
Bahunda
hy how are you?
Man
ys
Amisha
how are you guys
Sekou
f9 guys
Amisha
how are you guys
Sekou
ys am also fine
Amisha
fine and you guys
Geli
from Nepal
Amisha
nawalparasi district from belatari
Amisha
nd u
Amisha
I am Camara from Guinea west Africa... happy to meet you guys here
Sekou
ma management ho
Amisha
ahile becheclor ho
Amisha
hjr ktm bta ho ani k kaam grnu hunxa tw
Amisha
belatari
Amisha
1st year ho
Amisha
nd u
Amisha
ahh
Amisha
kaha biratnagar
Amisha
ys
Amisha
kina k vo
Amisha
money as unit of account means what?
Kalombe
A unit of account is something that can be used to value goods and services and make calculations
Jim
all of you please speak in English I can't understand you're language
Muhammad
I want to know how can we define macroeconomics in one line
Muhammad
it must be .9 or 0.9 no Mpc is greater than 1 Y=100+.9Y+50 Y-.9Y=150 0.1Y/0.1=150/0.1 Y=1500
Kalombe
Mercy is it clear?😋
Kalombe
hi can someone help me on this question If a negative shocks shifts the IS curve to the left, what type of policy do you suggest so as to stabilize the level of output? discuss your answer using appropriate graph.
Galge Reply
if interest rate is increased this will will reduce the level of income shifting the curve to the left ◀️
Kalombe
Got questions? Join the online conversation and get instant answers!
Jobilize.com Reply

Get Jobilize Job Search Mobile App in your pocket Now!

Get it on Google Play Download on the App Store Now


Source:  OpenStax, Collaborative statistics using spreadsheets. OpenStax CNX. Jan 05, 2016 Download for free at http://legacy.cnx.org/content/col11521/1.23
Google Play and the Google Play logo are trademarks of Google Inc.

Notification Switch

Would you like to follow the 'Collaborative statistics using spreadsheets' conversation and receive update notifications?

Ask