

| << Chapter < Page | Chapter >> Page > |
The antiderivatives of many functions either cannot be expressed or cannot be expressed easily in closed form (that is, in terms of known functions). Consequently, rather than evaluate definite integrals of these functions directly, we resort to various techniques of numerical integration to approximate their values. In this section we explore several of these techniques. In addition, we examine the process of estimating the error in using these techniques.
Earlier in this text we defined the definite integral of a function over an interval as the limit of Riemann sums . In general, any Riemann sum of a function over an interval may be viewed as an estimate of Recall that a Riemann sum of a function over an interval is obtained by selecting a partition
and a set
The Riemann sum corresponding to the partition and the set is given by where the length of the i th subinterval.
The midpoint rule for estimating a definite integral uses a Riemann sum with subintervals of equal width and the midpoints, of each subinterval in place of Formally, we state a theorem regarding the convergence of the midpoint rule as follows.
Assume that is continuous on Let n be a positive integer and If is divided into subintervals, each of length and is the midpoint of the i th subinterval, set
Then
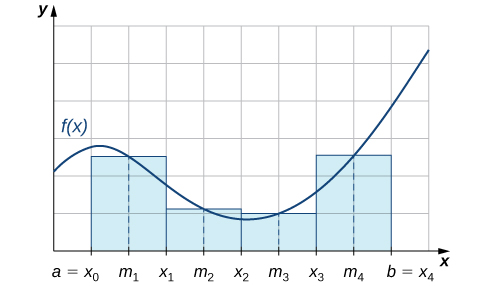
As we can see in [link] , if over then corresponds to the sum of the areas of rectangles approximating the area between the graph of and the x -axis over The graph shows the rectangles corresponding to for a nonnegative function over a closed interval
Use the midpoint rule to estimate using four subintervals. Compare the result with the actual value of this integral.
Each subinterval has length Therefore, the subintervals consist of
The midpoints of these subintervals are Thus,
Since
we see that the midpoint rule produces an estimate that is somewhat close to the actual value of the definite integral.
Use to estimate the length of the curve on
The length of on is
Since this integral becomes
If is divided into six subintervals, then each subinterval has length and the midpoints of the subintervals are If we set
Notification Switch
Would you like to follow the 'Calculus volume 2' conversation and receive update notifications?

|
|

|
|

|
|

|
|

|
|

|
|

|
|

|
|
|
|
|

|