This module provides an overview of Facts About the Correlation Coefficient for Linear Regression as a part of Collaborative Statistics collection (col10522) by Barbara Illowsky and Susan Dean.
A positive
means that when
increases,
increases and when
decreases,
decreases
(positive correlation) .
A negative
means that when
increases,
decreases and when
decreases,
increases
(negative correlation) .
An
of zero means there is absolutely no linear relationship between
and
(no correlation) .
High correlation does not suggest that
causes
or
causes
. We say
"correlation does not imply causation." For example, every person who learned
math in the 17th century is dead. However, learning math does not necessarily causedeath!
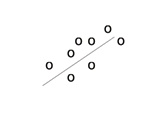
Positive correlation
A scatter plot showing data with a positive correlation.
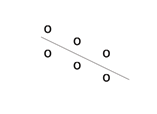
Negative correlation
A scatter plot showing data with a negative correlation.
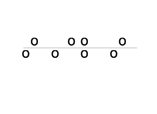
Zero correlation
A scatter plot showing data with zero correlation.
If
or
, then all the data points lie exactly on a straight line.
If the linear correlation is strong , then the line can be used to predict a
value.