Linear Regression and Correlation: The Correlation Coefficient and Coefficient of Determination is a part of Collaborative Statistics collection (col10522) by Barbara Illowsky and Susan Dean with contributions from Roberta Bloom. The name has been changed from Correlation Coefficient.
The correlation coefficient r
Besides looking at the scatter plot and seeing that a line seems reasonable, how can you
tell if the line is a good predictor? Use the correlation coefficient as another indicator(besides the scatterplot) of the strength of the relationship between
and
.
The
correlation coefficient, r, developed by Karl Pearson in the early 1900s, is a numerical measure of the strength of association between the independent variable x and the dependent variable y.
The correlation coefficient is calculated as
where
= the number of data points.
If you suspect a linear relationship between
and
, then
can measure how strong the linear relationship is.
What the value of r tells us:
The value of
is always between -1 and +1:
.
The size of the correlation
indicates the strength of the linear relationship between
and
. Values of
close to -1 or to +1 indicate a stronger linear relationship between
and
.
If
there is absolutely no linear relationship between
and
(no linear correlation) .
If
, there is perfect positive correlation. If
, there is perfect negative
correlation. In both these cases, all of the original data points lie on a straight line. Of course,in the real world, this will not generally happen.
What the sign of r tells us
A positive value of
means that when
increases,
tends to increase and when
decreases,
tends to decrease
(positive correlation) .
A negative value of
means that when
increases,
tends to decrease and when
decreases,
tends to increase
(negative correlation) .
The sign of
is the same as the sign of the slope,
,
of the best fit line.
Strong correlation does not suggest that
causes
or
causes
. We say
"correlation does not imply causation." For example, every person who learned
math in the 17th century is dead. However, learning math does not necessarily causedeath!
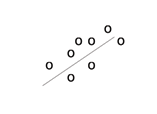
Positive correlation
A scatter plot showing data with a positive correlation.
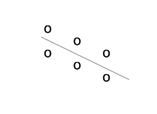
Negative correlation
A scatter plot showing data with a negative correlation.
Zero correlation
A scatter plot showing data with zero correlation.
=0
The formula for
looks formidable. However, computer spreadsheets, statistical software, and many calculators can quickly calculate
. The correlation coefficient
is the bottom item in the output screens for the LinRegTTest on the TI-83, TI-83+, or TI-84+ calculator (see previous section for instructions).
The coefficient of determination
is called the coefficient of determination.
is the square of the correlation coefficient , but is usually stated as a percent, rather than in decimal form.
has an interpretation in the context of the data:
, when expressed as a percent, represents the percent of variation in the dependent variable y that can be explained by variation in the independent variable x using the regression (best fit) line.
1-
, when expressed as a percent, represents the percent of variation in y that is NOT explained by variation in x using the regression line. This can be seen as the scattering of the observed data points about the regression line.
Approximately 44% of the variation (0.4397 is approximately 0.44) in the final exam grades can be explained by the variation in the grades on the third exam, using the best fit regression line.
Therefore approximately 56% of the variation (1 - 0.44 = 0.56) in the final exam grades can NOT be explained by the variation in the grades on the third exam, using the best fit regression line. (This is seen as the scattering of the points about the line.)
**With contributions from Roberta Bloom.
Questions & Answers
differentiate between demand and supply
giving examples
In economics, a perfect market refers to a theoretical construct where all participants have perfect information, goods are homogenous, there are no barriers to entry or exit, and prices are determined solely by supply and demand. It's an idealized model used for analysis,
When MP₁ becomes negative, TP start to decline.
Extuples Suppose that the short-run production function of certain cut-flower firm is given by: Q=4KL-0.6K2 - 0.112 •
Where is quantity of cut flower produced, I is labour input and K is fixed capital input (K-5). Determine the average product of lab
Kelo
Extuples Suppose that the short-run production function of certain cut-flower firm is given by: Q=4KL-0.6K2 - 0.112 •
Where is quantity of cut flower produced, I is labour input and K is fixed capital input (K-5). Determine the average product of labour (APL) and marginal product of labour (MPL)
Quantity demanded refers to the specific amount of a good or service that consumers are willing and able to purchase at a give price and within a specific time period. Demand, on the other hand, is a broader concept that encompasses the entire relationship between price and quantity demanded
Ezea
ok
Shukri
how do you save a country economic situation when it's falling apart
Economic growth as an increase in the production and consumption of goods and services within an economy.but
Economic development as a broader concept that encompasses not only economic growth but also social & human well being.
Shukri
production function means
Jabir
What do you think is more important to focus on when considering inequality ?
sir...I just want to ask one question... Define the term contract curve? if you are free please help me to find this answer 🙏
Asui
it is a curve that we get after connecting the pareto optimal combinations of two consumers after their mutually beneficial trade offs
Awais
thank you so much 👍 sir
Asui
In economics, the contract curve refers to the set of points in an Edgeworth box diagram where both parties involved in a trade cannot be made better off without making one of them worse off. It represents the Pareto efficient allocations of goods between two individuals or entities, where neither p
Cornelius
In economics, the contract curve refers to the set of points in an Edgeworth box diagram where both parties involved in a trade cannot be made better off without making one of them worse off. It represents the Pareto efficient allocations of goods between two individuals or entities,
Cornelius
Suppose a consumer consuming two commodities X and Y has
The following utility function u=X0.4 Y0.6. If the price of the X and Y are 2 and 3 respectively and income Constraint is birr 50.
A,Calculate quantities of x and y which maximize utility.
B,Calculate value of Lagrange multiplier.
C,Calculate quantities of X and Y consumed with a given price.
D,alculate optimum level of output .
the market for lemon has 10 potential consumers, each having an individual demand curve p=101-10Qi, where p is price in dollar's per cup and Qi is the number of cups demanded per week by the i th consumer.Find the market demand curve using algebra. Draw an individual demand curve and the market dema
suppose the production function is given by ( L, K)=L¼K¾.assuming capital is fixed find APL and MPL. consider the following short run production function:Q=6L²-0.4L³ a) find the value of L that maximizes output b)find the value of L that maximizes marginal product