<< Chapter < Page Chapter >> Page >

Mathematics

Mathematics in the world around us

Educator section

Memorandum

Critical and developmental outcomes:

The learners must be able to:

1. identify and solve problems and make decisions using critical and creative thinking;

2. work effectively with others as members of a team, group, organisation and community;

3. organise and manage themselves and their activities responsibly and effectively;

4. collect, analyse, organise and critically evaluate information;

5. communicate effectively using visual, symbolic and/or language skills in various modes;

6. use science and technology effectively and critically, showing responsibility towards the environment and the health of others;

6. demonstrate an understanding of the world as a set of related systems by recognising that problem-solving contexts do not exist in isolation;

7. reflect on and explore a variety of strategies to learn more effectively;

8. participate as responsible citizens in the life of local, national, and global communities;

9. be culturally and aesthetically sensitive across a range of social contexts;

10. explore education and career opportunities; and

develop entrepreneurial opportunities.
  • Integration of Themes:
  • A healthy environment: Many vehicles use our roads and these are a source of pollution. Discuss. Safety on the roads is essential. Learners must obey road rules and safety measures taken by the school and road authorities. Discuss how learners can be safe while walking / travelling to and from school.
  • Plants and flowers make our environment pretty and attractive. Learners must know these should be protected and not destroyed.
  • Inclusively: Man, animals and plants all rely on one another to survive. Discuss this statement and give examples.
  • Vehicles are essentially part of the learner’s experience and through these activities of counting to 150, a graph determining distances and vehicles, and the extension of bonds of 16, are used.
  • Up to 50 objects are estimated, grouped and counted.
  • The multiplication tables of 2 is introduced and addition and subtraction of 6, 7, 8 and 9 included.
  • Shapes are identified and sorted by colouring

Leaner section

Content

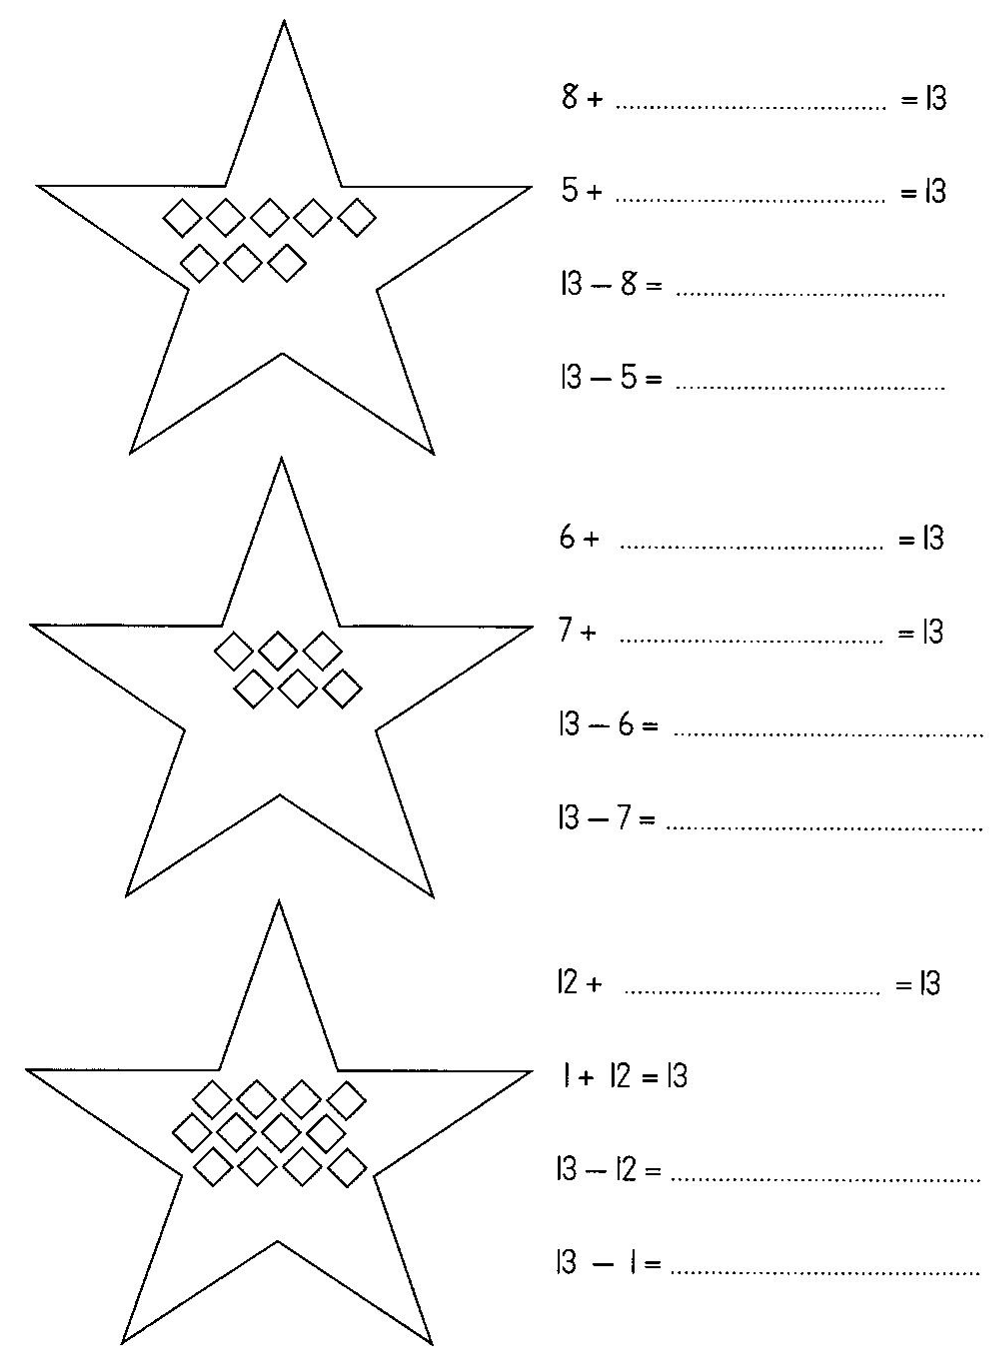
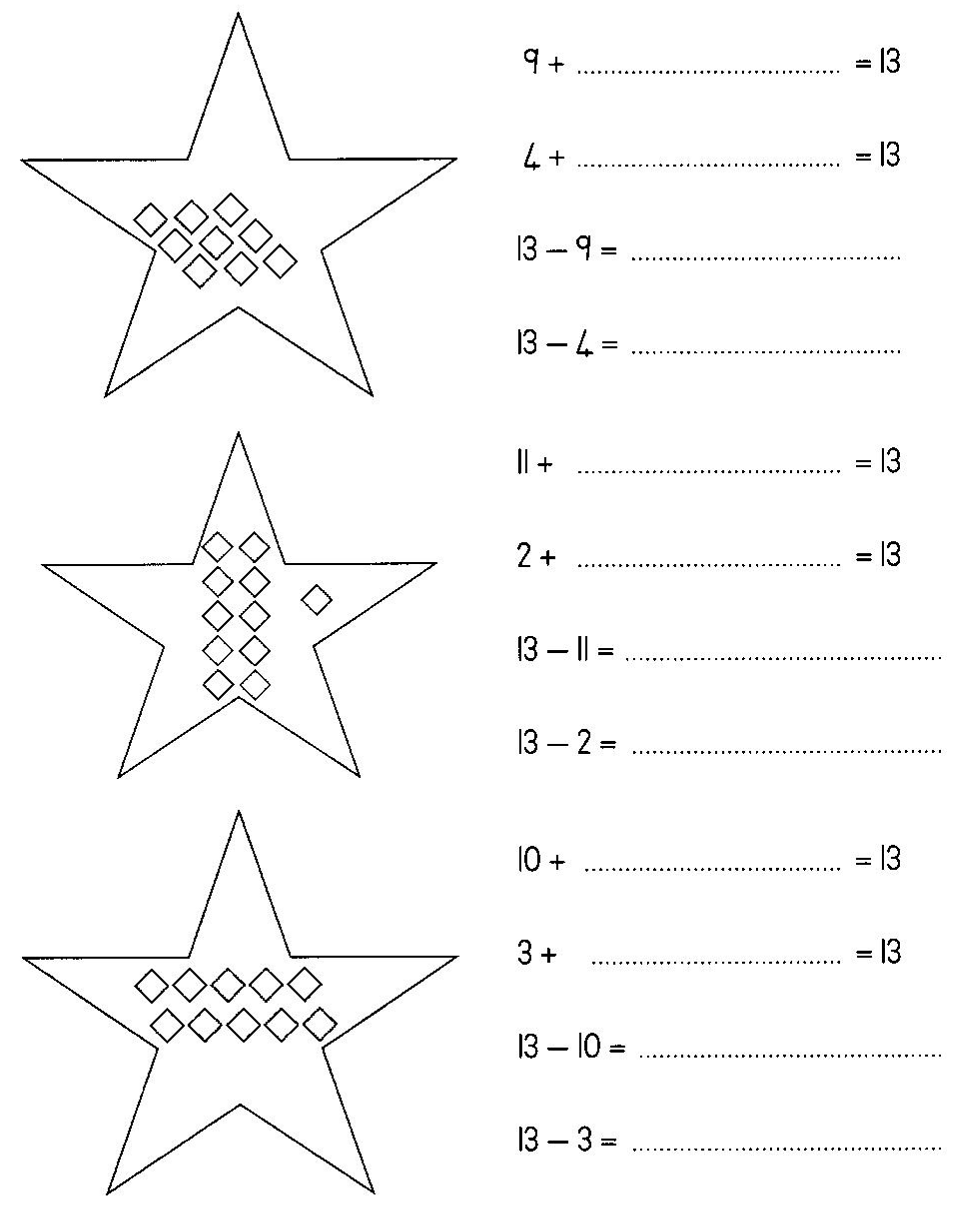
Activity: all about thirteen [lo 1.9.1, lo 5.4, lo 5.5]

  • Draw and colour in enough diamonds in each star to make 13.
  • Complete the number sentences.
LO 1.9.1
LO 1.9.1
LO 5.4
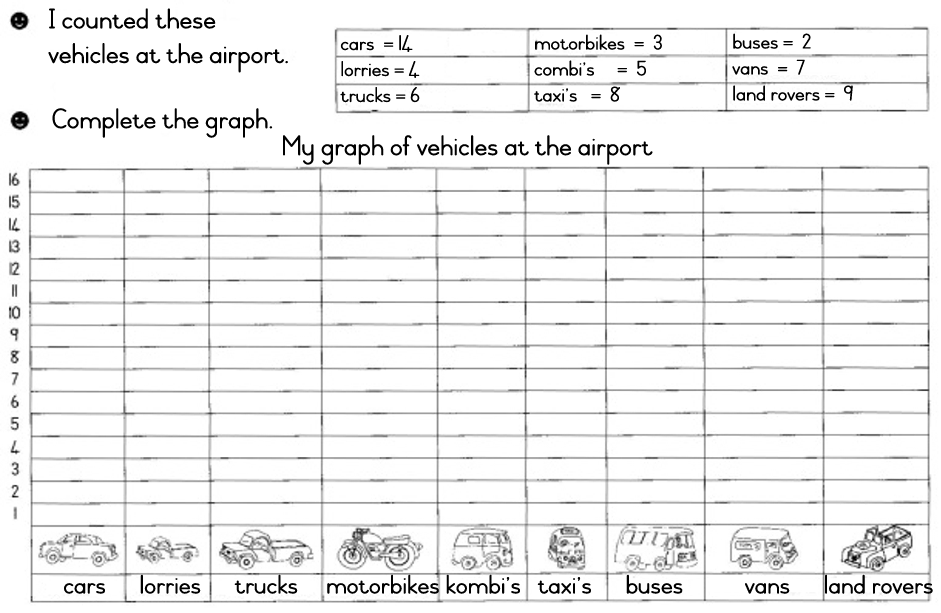
  • Look at your graph
  • Answer these questions.

1. How many cars were there? ________________________cars.

2. How many land rovers were there? ______________________ land rovers.

3. Were there more or less cars than land rovers?

There were ________________ cars than land rovers.

4. The ______________________________ were the least.

5. There were _____________________________ more trucks than lorries.

6. There were ______________________________ less taxi’s than cars.

7. There were __________________________ trucks and lorries altogether.

8. There were _____________________________ less buses than vans.

9. How many motorbikes, kombi’s and taxi’s were there altogether? _________

LO 5.5

Assessment

Learning Outcome 1: The learner will be able to recognise, describe and represent numbers and their relationships, and to count, estimate, calculate and check with competence and confidence in solving problems.

Assessment Standard 1.9: We know this when the learner performs mental calculations involving:

1.9.1 addition and subtraction for numbers to at least 20;

Learning Outcome 5: The learner will be able to collect, summarise, display and critically analyse data in order to draw conclusions and make predictions, and to interpret and determine chance variation.

Assessment Standard 5.4: We know this when the learner draws pictures and constructs pictographs that have a 1-1 correspondence between own data and representations;

Assessment Standard 5.5: We know this when the learner describes own or a peer’s collection of objects, explains how it was sorted, and answers questions about it.

Questions & Answers

how do you get the 2/50
Abba Reply
number of sport play by 50 student construct discrete data
Aminu Reply
width of the frangebany leaves on how to write a introduction
Theresa Reply
Solve the mean of variance
Veronica Reply
Step 1: Find the mean. To find the mean, add up all the scores, then divide them by the number of scores. ... Step 2: Find each score's deviation from the mean. ... Step 3: Square each deviation from the mean. ... Step 4: Find the sum of squares. ... Step 5: Divide the sum of squares by n – 1 or N.
kenneth
what is error
Yakuba Reply
Is mistake done to something
Vutshila
Hy
anas
hy
What is the life teble
anas
hy
Jibrin
statistics is the analyzing of data
Tajudeen Reply
what is statics?
Zelalem Reply
how do you calculate mean
Gloria Reply
diveving the sum if all values
Shaynaynay
let A1,A2 and A3 events be independent,show that (A1)^c, (A2)^c and (A3)^c are independent?
Fisaye Reply
what is statistics
Akhisani Reply
data collected all over the world
Shaynaynay
construct a less than and more than table
Imad Reply
The sample of 16 students is taken. The average age in the sample was 22 years with astandard deviation of 6 years. Construct a 95% confidence interval for the age of the population.
Aschalew Reply
Bhartdarshan' is an internet-based travel agency wherein customer can see videos of the cities they plant to visit. The number of hits daily is a normally distributed random variable with a mean of 10,000 and a standard deviation of 2,400 a. what is the probability of getting more than 12,000 hits? b. what is the probability of getting fewer than 9,000 hits?
Akshay Reply
Bhartdarshan'is an internet-based travel agency wherein customer can see videos of the cities they plan to visit. The number of hits daily is a normally distributed random variable with a mean of 10,000 and a standard deviation of 2,400. a. What is the probability of getting more than 12,000 hits
Akshay
1
Bright
Sorry i want to learn more about this question
Bright
Someone help
Bright
a= 0.20233 b=0.3384
Sufiyan
a
Shaynaynay
How do I interpret level of significance?
Mohd Reply
It depends on your business problem or in Machine Learning you could use ROC- AUC cruve to decide the threshold value
Shivam
how skewness and kurtosis are used in statistics
Owen Reply
yes what is it
Taneeya
Got questions? Join the online conversation and get instant answers!
Jobilize.com Reply

Get Jobilize Job Search Mobile App in your pocket Now!

Get it on Google Play Download on the App Store Now


Source:  OpenStax, Mathematics grade 2. OpenStax CNX. Oct 15, 2009 Download for free at http://cnx.org/content/col11131/1.1
Google Play and the Google Play logo are trademarks of Google Inc.

Notification Switch

Would you like to follow the 'Mathematics grade 2' conversation and receive update notifications?

Ask