<< Chapter < Page Chapter >> Page >
Results of experimentation with matched filter technique.

Trial 1 results

The first run through of our program showed promising results for the numbers, but less than stellar results for some of the letters. After several rounds of experimentation, we identified several ways to improve our algorithm. One major change was standard cropping for the template characters and the test license plate. While our original template dictionary images were cropped from the original images downloaded from the camera phone, our test images were obtained from a 256 by 400 pixel crop, thus there were slight differences in the images which lead to results that were not passing the matched filter test. Because matched filter is a very sensitive test, it responds to even the slightest changes that may not be detectable by a quick glance from a human eye.

Another adjustment that improved our results was flipping the image right to left and upside down before applying the 'conv2' function. This set up our image so that applying the function was equivalent to calculating a correlation, yielding significantly more sensitive and accurate results.

Trial 2 results

After changing our template dictionary samples so our dictionary and test images were cropped from a 256 by 400 pixel image and making adjustments to the image before applying ‘conv2’, we saw much better results. Our program accurately identifies characters on this type of Texas plate, returning the correct characters in order. Thus far it has produced accurate results on the five plates we have tested on, with an average processing time of 0.78252 seconds.

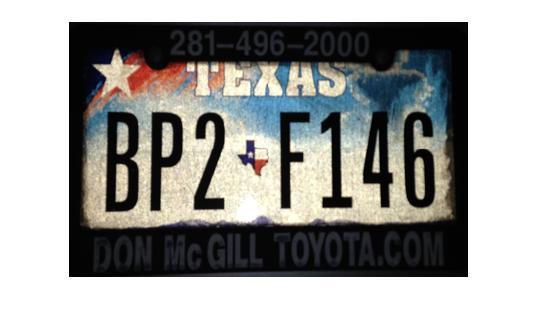
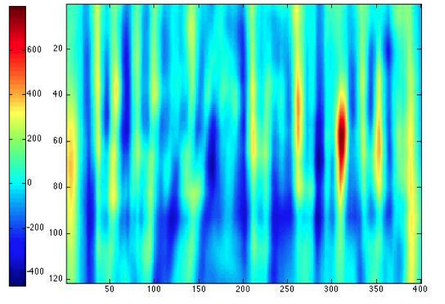
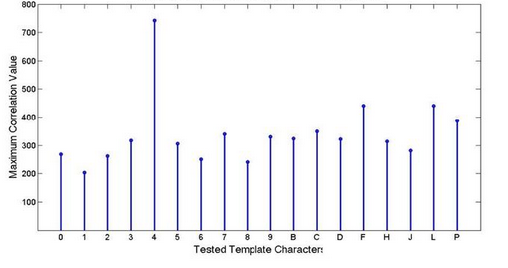
For one of our test images, license plate 'BP2F146' (Figure 1) we tested the template dictionary character '4' with the entire license plate. The results showed that the program found the location and match of '4' on the right place in the license plate, as shown in a heat map in Figure 2. This visual also shows the low correlation, represented by cooler colors, of the other pixels of the license plate with the template '4' character. Figure 3 shows the results of correlating position six (sixth character) on the license plate with the entire template dictionary. In this case, the sixth character is '4' and the stem plot shows that indeed the template '4' was chosen as the highest match and most probable choice. However, our experiments did reveal that other characters do not produce as distinct correlation results and may not offer an obvious match choice. When correlation values are close, our program will always choose the highest one which could possibly lead to an incorrect detection.

Test license plate

Test License Plate
Image of Texas License Plate used for testing.

Template character '4' identified and located on license plate

4 Correlation
Correlation of license plate with template character ‘4’ produces this heat map with correct location of '4' at position six.

'4' identified as most likely match at position six

Position 6 Correlation
Correlation results of position six on the test license plate with all the template characters, shows ‘4’ as the match.

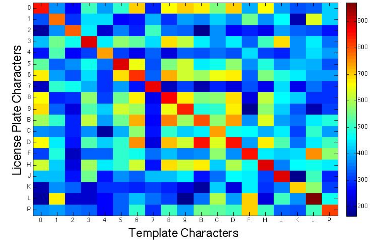
To further illustrate the degree of accuracy of our program, we have constructed a Confusion Matrix of the correlation results (Figure 4) between license plate characters and the template dictionary characters. After running our program on several test license plates, we obtain the average correlation value between each character and the template dictionary to create this data visualization that shows the highest matches in warm colors. Through this diagram, it can be seen that the close matches lie along the diagonal of the matrix, which is ideal as the diagonal represents the matching characters between the template dictionary and license plate. However, on this figure it is also easy to visualize the "trouble characters", such as the '8', 'B', and the 'D', which are slightly off the diagonal and may show similar high correlation values even when they are not the correct match.

Visualization of high correlation values between matches

Confusion Matrix
Confusion Matrix illustrating the highest matches with warm colors.

Questions & Answers

differentiate between demand and supply giving examples
Lambiv Reply
differentiated between demand and supply using examples
Lambiv
what is labour ?
Lambiv
how will I do?
Venny Reply
how is the graph works?I don't fully understand
Rezat Reply
information
Eliyee
devaluation
Eliyee
t
WARKISA
hi guys good evening to all
Lambiv
multiple choice question
Aster Reply
appreciation
Eliyee
explain perfect market
Lindiwe Reply
In economics, a perfect market refers to a theoretical construct where all participants have perfect information, goods are homogenous, there are no barriers to entry or exit, and prices are determined solely by supply and demand. It's an idealized model used for analysis,
Ezea
What is ceteris paribus?
Shukri Reply
other things being equal
AI-Robot
When MP₁ becomes negative, TP start to decline. Extuples Suppose that the short-run production function of certain cut-flower firm is given by: Q=4KL-0.6K2 - 0.112 • Where is quantity of cut flower produced, I is labour input and K is fixed capital input (K-5). Determine the average product of lab
Kelo
Extuples Suppose that the short-run production function of certain cut-flower firm is given by: Q=4KL-0.6K2 - 0.112 • Where is quantity of cut flower produced, I is labour input and K is fixed capital input (K-5). Determine the average product of labour (APL) and marginal product of labour (MPL)
Kelo
yes,thank you
Shukri
Can I ask you other question?
Shukri
what is monopoly mean?
Habtamu Reply
What is different between quantity demand and demand?
Shukri Reply
Quantity demanded refers to the specific amount of a good or service that consumers are willing and able to purchase at a give price and within a specific time period. Demand, on the other hand, is a broader concept that encompasses the entire relationship between price and quantity demanded
Ezea
ok
Shukri
how do you save a country economic situation when it's falling apart
Lilia Reply
what is the difference between economic growth and development
Fiker Reply
Economic growth as an increase in the production and consumption of goods and services within an economy.but Economic development as a broader concept that encompasses not only economic growth but also social & human well being.
Shukri
production function means
Jabir
What do you think is more important to focus on when considering inequality ?
Abdisa Reply
any question about economics?
Awais Reply
sir...I just want to ask one question... Define the term contract curve? if you are free please help me to find this answer 🙏
Asui
it is a curve that we get after connecting the pareto optimal combinations of two consumers after their mutually beneficial trade offs
Awais
thank you so much 👍 sir
Asui
In economics, the contract curve refers to the set of points in an Edgeworth box diagram where both parties involved in a trade cannot be made better off without making one of them worse off. It represents the Pareto efficient allocations of goods between two individuals or entities, where neither p
Cornelius
In economics, the contract curve refers to the set of points in an Edgeworth box diagram where both parties involved in a trade cannot be made better off without making one of them worse off. It represents the Pareto efficient allocations of goods between two individuals or entities,
Cornelius
Suppose a consumer consuming two commodities X and Y has The following utility function u=X0.4 Y0.6. If the price of the X and Y are 2 and 3 respectively and income Constraint is birr 50. A,Calculate quantities of x and y which maximize utility. B,Calculate value of Lagrange multiplier. C,Calculate quantities of X and Y consumed with a given price. D,alculate optimum level of output .
Feyisa Reply
Answer
Feyisa
c
Jabir
the market for lemon has 10 potential consumers, each having an individual demand curve p=101-10Qi, where p is price in dollar's per cup and Qi is the number of cups demanded per week by the i th consumer.Find the market demand curve using algebra. Draw an individual demand curve and the market dema
Gsbwnw Reply
suppose the production function is given by ( L, K)=L¼K¾.assuming capital is fixed find APL and MPL. consider the following short run production function:Q=6L²-0.4L³ a) find the value of L that maximizes output b)find the value of L that maximizes marginal product
Abdureman
types of unemployment
Yomi Reply
What is the difference between perfect competition and monopolistic competition?
Mohammed
Got questions? Join the online conversation and get instant answers!
Jobilize.com Reply

Get Jobilize Job Search Mobile App in your pocket Now!

Get it on Google Play Download on the App Store Now


Source:  OpenStax, Elec 301 projects fall 2013. OpenStax CNX. Sep 14, 2014 Download for free at http://legacy.cnx.org/content/col11709/1.1
Google Play and the Google Play logo are trademarks of Google Inc.

Notification Switch

Would you like to follow the 'Elec 301 projects fall 2013' conversation and receive update notifications?

Ask