<< Chapter < Page Chapter >> Page >

Natuurwetenskappe

Materie, meting en reaksies

Reaksies tussen soorte materie: sure en basisse

Opvoeder afdeling

Memorandum

Dit is baie belangrik dat u vooraf seker maak dat die stowwe wat die groepe bymekaar gemaak het, veilig is om aan te proe.

Swart tee as indikator.

SURE NEUTRAAL BASISSE

Sout en Asyn Vanieljegeursel (soet) Kakaopoeier

Speserye Kitssop (sout) Groen peper

Borrie Appelasyn Koeksoda

Suurlemoensap Sjokolade

Leerder afdeling

Inhoud

WAARSKUWING

  • Ons almal het sintuie om die verskillende aspekte van ons omgewing waar te neem. Jou tong is die sinsorgaan wat jou in staat stel om deur proe die smaak van stowwe waar te neem. Moet egter nooit aan stowwe proe nie, tensy jy baie seker is dat dit veilig is! Dikwels bewaar mense stowwe in houers sonder om die nodige etikette daarop aan te bring. Gevaarlike stowwe kom gereeld in en om ons huis voor, bv. batterysuur, ammoniak en swembadsuur. Onthou dus: moenie aan iets proe nie, tensy jy dit as ‘n veilige stof geïdentifiseer het.

Aktiwiteit: om sure en basisse in en om die huis te kan identifiseer [lu 1.2, lu 2.2]

Die meeste sure het ‘n suur smaak, terwyl die meeste basisse bitter smaak. Hierdie smake word deur die agterste gedeelte van die tong waargeneem. Ons proe ook dikwels met die voorste gedeelte van die tong stowwe wat soet of sout smaak. Hierdie stowwe is nie sure of basisse nie, maar is neutraal.

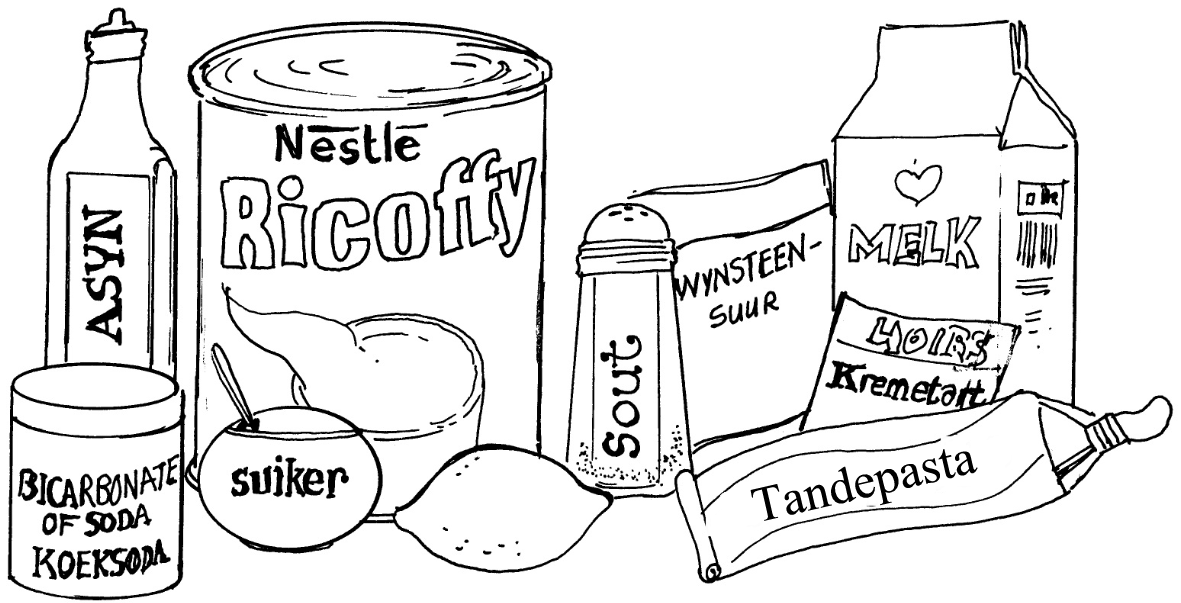
Loer so ‘n bietjie in Ma se kombuiskaste en bring van die volgende items saam skool toe:

  • Maak seker by jou ma dat jy nie gevaarlike stowwe soos ammoniak of bleikmiddel saambring nie.
  • Verdeel in groepe en maak ‘n lys van die stowwe wat julle in die groep het.
  • Vra jou onderwyser om julle te help om seker te maak dat al die stowwe veilig is om aan te proe.

Voltooi die volgende tabel deur aan al die stowwe te proe en jou waarnemings neer te skryf.

SUREHierdie stowwe proe suur NEUTRAALHierdie stowwe proe nie suur of bitter nie BASISSEHierdie stowwe proe bitter
______________________________________________________________________________________________________________ ______________________________________________________________________________________________________________ ______________________________________________________________________________________________________________
______________________________________________________________________________________________________________ ______________________________________________________________________________________________________________ ______________________________________________________________________________________________________________
______________________________________________________________________________________________________________ ______________________________________________________________________________________________________________ ______________________________________________________________________________________________________________
______________________________________________________________________________________________________________ ______________________________________________________________________________________________________________ ______________________________________________________________________________________________________________
______________________________________________________________________________________________________________ ______________________________________________________________________________________________________________ ______________________________________________________________________________________________________________

(15)

Vergelyk nou jou persoonlike ondervinding met dié van die ander lede in jou groep. Klassifiseer die stowwe in jul groep volgens smaak. Vergelyk dit met die ander groepe.

  • Het almal saamgestem oor die smake van al die stowwe? __________________
  • Indien nie, oor watter stowwe was daar verskil?

_____________________________________________________________________

_____________________________________________________________________

_____________________________________________________________________

_____________________________________________________________________

_____________________________________________________________________

_____________________________________________________________________

Assessering

Leeruitkomste 1: Die leerder is in staat om met selfvertroue op weetgierigheid oor natuurlike verskynsels te reageer, en om binne die konteks van wetenskap, tegnologie en die omgewing verbande te ondersoek en probleme op te los.

Assesseringstandaard 1.2: Dit is duidelik wanneer die leerder ondersoeke uitvoer en data versamel: organiseer en gebruik apparaat/toerusting of bronne om inligting in te win en te noteer.

Leeruitkomste 2: Die leerder ken, interpreteer en pas wetenskaplike, tegnologiese en omgewingskennis toe.

Assesseringstandaard 2.2: Dit is duidelik wanneer die leerder inligting kan kategoriseer: vergelyk kenmerke van verskillende kategorieë voorwerpe, organismes en gebeurtenisse.

Questions & Answers

differentiate between demand and supply giving examples
Lambiv Reply
differentiated between demand and supply using examples
Lambiv
what is labour ?
Lambiv
how will I do?
Venny Reply
how is the graph works?I don't fully understand
Rezat Reply
information
Eliyee
devaluation
Eliyee
t
WARKISA
hi guys good evening to all
Lambiv
multiple choice question
Aster Reply
appreciation
Eliyee
explain perfect market
Lindiwe Reply
In economics, a perfect market refers to a theoretical construct where all participants have perfect information, goods are homogenous, there are no barriers to entry or exit, and prices are determined solely by supply and demand. It's an idealized model used for analysis,
Ezea
What is ceteris paribus?
Shukri Reply
other things being equal
AI-Robot
When MP₁ becomes negative, TP start to decline. Extuples Suppose that the short-run production function of certain cut-flower firm is given by: Q=4KL-0.6K2 - 0.112 • Where is quantity of cut flower produced, I is labour input and K is fixed capital input (K-5). Determine the average product of lab
Kelo
Extuples Suppose that the short-run production function of certain cut-flower firm is given by: Q=4KL-0.6K2 - 0.112 • Where is quantity of cut flower produced, I is labour input and K is fixed capital input (K-5). Determine the average product of labour (APL) and marginal product of labour (MPL)
Kelo
yes,thank you
Shukri
Can I ask you other question?
Shukri
what is monopoly mean?
Habtamu Reply
What is different between quantity demand and demand?
Shukri Reply
Quantity demanded refers to the specific amount of a good or service that consumers are willing and able to purchase at a give price and within a specific time period. Demand, on the other hand, is a broader concept that encompasses the entire relationship between price and quantity demanded
Ezea
ok
Shukri
how do you save a country economic situation when it's falling apart
Lilia Reply
what is the difference between economic growth and development
Fiker Reply
Economic growth as an increase in the production and consumption of goods and services within an economy.but Economic development as a broader concept that encompasses not only economic growth but also social & human well being.
Shukri
production function means
Jabir
What do you think is more important to focus on when considering inequality ?
Abdisa Reply
any question about economics?
Awais Reply
sir...I just want to ask one question... Define the term contract curve? if you are free please help me to find this answer 🙏
Asui
it is a curve that we get after connecting the pareto optimal combinations of two consumers after their mutually beneficial trade offs
Awais
thank you so much 👍 sir
Asui
In economics, the contract curve refers to the set of points in an Edgeworth box diagram where both parties involved in a trade cannot be made better off without making one of them worse off. It represents the Pareto efficient allocations of goods between two individuals or entities, where neither p
Cornelius
In economics, the contract curve refers to the set of points in an Edgeworth box diagram where both parties involved in a trade cannot be made better off without making one of them worse off. It represents the Pareto efficient allocations of goods between two individuals or entities,
Cornelius
Suppose a consumer consuming two commodities X and Y has The following utility function u=X0.4 Y0.6. If the price of the X and Y are 2 and 3 respectively and income Constraint is birr 50. A,Calculate quantities of x and y which maximize utility. B,Calculate value of Lagrange multiplier. C,Calculate quantities of X and Y consumed with a given price. D,alculate optimum level of output .
Feyisa Reply
Answer
Feyisa
c
Jabir
the market for lemon has 10 potential consumers, each having an individual demand curve p=101-10Qi, where p is price in dollar's per cup and Qi is the number of cups demanded per week by the i th consumer.Find the market demand curve using algebra. Draw an individual demand curve and the market dema
Gsbwnw Reply
suppose the production function is given by ( L, K)=L¼K¾.assuming capital is fixed find APL and MPL. consider the following short run production function:Q=6L²-0.4L³ a) find the value of L that maximizes output b)find the value of L that maximizes marginal product
Abdureman
types of unemployment
Yomi Reply
What is the difference between perfect competition and monopolistic competition?
Mohammed
Got questions? Join the online conversation and get instant answers!
Jobilize.com Reply

Get Jobilize Job Search Mobile App in your pocket Now!

Get it on Google Play Download on the App Store Now


Source:  OpenStax, Natuurwetenskappe graad 7. OpenStax CNX. Sep 16, 2009 Download for free at http://cnx.org/content/col11078/1.1
Google Play and the Google Play logo are trademarks of Google Inc.

Notification Switch

Would you like to follow the 'Natuurwetenskappe graad 7' conversation and receive update notifications?

Ask