Writing equations in the standard form: First an e
x ample:
6
x
+ 2
y – 1 = 0
Keep the term inyon the left; move the other two to the right.
2
y = –6
x + 1
Now make the coefficient ofy= 1 by dividing all the terms by 2.
y
= –3
x + ½
This the standard form.
Here
m = –3 and
c = ½.
Now you practise some – also write down what
m and
c are, as above.
1.1 2
x +
y = 3
1.2 3
y – 9 = 6
x
1.3 3
x = 6
y
1.4 2
y – 8 = 0
2 Understanding the gradient.
Previously we mentioned that the steepness of a graph can be calculated – this is very easy if the graph is a straight line, because it is equally steep everywhere – we say that the gradient of a straight-line graph remains constant.
Study the values of m in the six graphs in the previous exercise
If your work is correct, you will have noticed that the graphs slope up to the right where m is positive, and the graphs slope down to the right where m is negative.
In other word, m tells us about the gradient. (What do you think happens in y = 4, the odd one out?)
With
m positive, the number of units the line goes up for every unit it goes right gives us
m (the gradient). When
m is negative, we count how many units the line goes down for every unit it goes right.
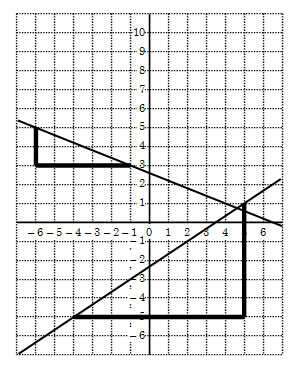
Here are two examples. By completing right-angled triangles in a convenient position on the lines in the graph, we can easily calculate the two gradients, as follows:
For the top line:
, because the line goes down to the right, we know the gradient is negative; 2 is the height of the triangle and 5 is its length.
For the bottom line:
, with 6 the height of the triangle, and 9 its length. We don’t write the +, and we simplify the fraction.
2.1 Now go back to the previous six graphs and do the same so that you can confirm that the
m in the equation agrees with the gradient you calculate from the graph itself. Also notice how the size of
m tells you how steep the graph is.
3 Finding out where the graph cuts the
y –axis (called the
y –intercept):
If you study the equations of the six graphs, you will notice that the constant term (
c ) in the standard form tells us exactly where the graph cuts the
y –axis!
For e
x ample, in
y = 3
x –4, the
y –intercept is at –4 on the
y –axis.
Confirm that this is true for all six graphs.
Now we have a method for drawing graphs from an equation in the standard form. We don’t have to make a table – we simply use the
y –intercept (given to us by
c ), and the gradient (given by
m ).
On the graph paper, mark the
y –intercept. Now use the gradient in the form of a fraction; if it is a whole number, then write it with
1 as a denominator. From the
y –intercept, count as many units to the right as the denominator. From there count as many units as the numerator
up, if
m is positive, or
down, if
m is
negative . Here are two examples:
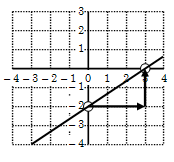
(a)
The y-intercept is –2, marked on the y-axis with a circle. The gradient is
, so we move from the circle three units to the right, and then 2 units up (not down – the gradient is positive). Another circle marks the spot we end up at. And now we draw the straight line through these two spots.