<< Chapter < Page Chapter >> Page >

For the vector-valued function r ( t ) = ( t 2 3 t ) i + ( 4 t + 1 ) j , evaluate r ( 0 ) , r ( 1 ) , and r ( −4 ) . Does this function have any domain restrictions?

r ( 0 ) = j , r ( 1 ) = −2 i + 5 j , r ( −4 ) = 28 i 15 j

The domain of r ( t ) = ( t 2 3 t ) i + ( 4 t + 1 ) j is all real numbers.

Got questions? Get instant answers now!

[link] illustrates an important concept. The domain of a vector-valued function consists of real numbers. The domain can be all real numbers or a subset of the real numbers. The range of a vector-valued function consists of vectors. Each real number in the domain of a vector-valued function is mapped to either a two- or a three-dimensional vector.

Graphing vector-valued functions

Recall that a plane vector consists of two quantities: direction and magnitude. Given any point in the plane (the initial point    ), if we move in a specific direction for a specific distance, we arrive at a second point. This represents the terminal point    of the vector. We calculate the components of the vector by subtracting the coordinates of the initial point from the coordinates of the terminal point.

A vector is considered to be in standard position if the initial point is located at the origin. When graphing a vector-valued function, we typically graph the vectors in the domain of the function in standard position, because doing so guarantees the uniqueness of the graph. This convention applies to the graphs of three-dimensional vector-valued functions as well. The graph of a vector-valued function of the form r ( t ) = f ( t ) i + g ( t ) j consists of the set of all ( t , r ( t ) ) , and the path it traces is called a plane curve    . The graph of a vector-valued function of the form r ( t ) = f ( t ) i + g ( t ) j + h ( t ) k consists of the set of all ( t , r ( t ) ) , and the path it traces is called a space curve    . Any representation of a plane curve or space curve using a vector-valued function is called a vector parameterization    of the curve.

Graphing a vector-valued function

Create a graph of each of the following vector-valued functions:

  1. The plane curve represented by r ( t ) = 4 cos t i + 3 sin t j , 0 t 2 π
  2. The plane curve represented by r ( t ) = 4 cos t 3 i + 3 sin t 3 j , 0 t 2 π
  3. The space curve represented by r ( t ) = cos t i + sin t j + t k , 0 t 4 π
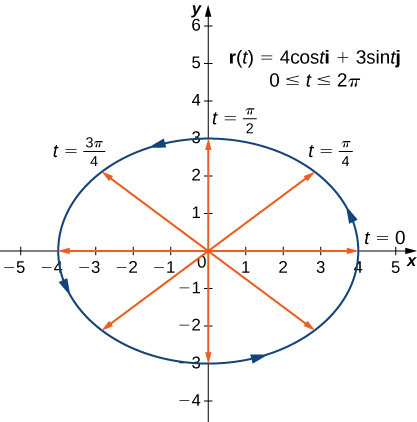
  1. As with any graph, we start with a table of values. We then graph each of the vectors in the second column of the table in standard position and connect the terminal points of each vector to form a curve ( [link] ). This curve turns out to be an ellipse centered at the origin.
    Table of values for r ( t ) = 4 cos t i + 3 sin t j , 0 t 2 π
    t r ( t ) t r ( t )
    0 4 i π −4 i
    π 4 2 2 i + 3 2 2 j 5 π 4 −2 2 i 3 2 2 j
    π 2 3 j 3 π 2 −3 j
    3 π 4 −2 2 i + 3 2 2 j 7 π 4 2 2 i 3 2 2 j
    2 π 4 i
    This figure is a graph of an ellipse centered at the origin. The graph is the vector-valued function r(t)=4cost i + 3sint j. The ellipse has arrows on the curve representing counter-clockwise orientation. There are also line segments inside of the ellipse to the curve at different increments of t. The increments are t=0, t=pi/4, t=pi/2, t=3pi/4.
    The graph of the first vector-valued function is an ellipse.
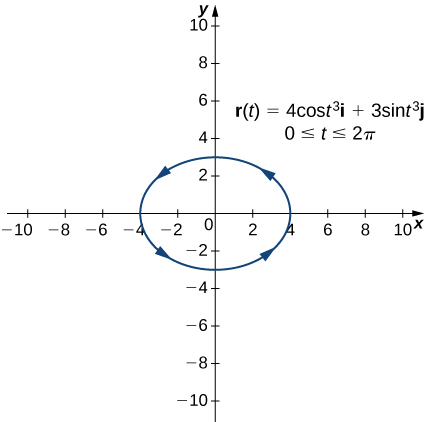
  2. The table of values for r ( t ) = 4 cos t i + 3 sin t j , 0 t 2 π is as follows:
    Table of values for r ( t ) = 4 cos t i + 3 sin t j , 0 t 2 π
    t r ( t ) t r ( t )
    0 4 i π −4 i
    π 4 2 2 i + 3 2 2 j 5 π 4 −2 2 i 3 2 2 j
    π 2 3 j 3 π 2 −3 j
    3 π 4 −2 2 i + 3 2 2 j 7 π 4 2 2 i 3 2 2 j
    2 π 4 i

    The graph of this curve is also an ellipse centered at the origin.
    This figure is a graph of an ellipse centered at the origin. The graph is the vector-valued function r(t)=4cost^3 i + 3sint^3 j.
    The graph of the second vector-valued function is also an ellipse.
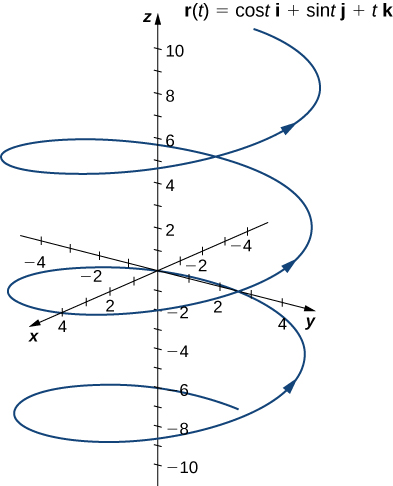
  3. We go through the same procedure for a three-dimensional vector function.
    Table of values for r ( t ) = cos t i + sin t j + t k , 0 t 4 π
    t r ( t ) t r ( t )
    0 4 i π −4 j + π k
    π 4 2 2 i + 2 2 j + π 4 k 5 π 4 −2 2 i 2 2 j + 5 π 4 k
    π 2 4 j + π 2 k 3 π 2 −4 j + 3 π 2 k
    3 π 4 −2 2 i + 2 2 j + 3 π 4 k 7 π 4 2 2 i 2 2 j + 7 π 4 k
    2 π 4 i + 2 π k

    The values then repeat themselves, except for the fact that the coefficient of k is always increasing ( [link] ). This curve is called a helix    . Notice that if the k component is eliminated, then the function becomes r ( t ) = cos t i + sin t j , which is a unit circle centered at the origin.
    This figure is the graph of a helix in the 3 dimensional coordinate system. The curve represents the function r(t) = cost i + sint j + tk. The curve spirals in a circular path around the vertical z-axis and has the look of a spring. The arrows on the curve represent orientation.
    The graph of the third vector-valued function is a helix.
Got questions? Get instant answers now!
Practice Key Terms 8

Get Jobilize Job Search Mobile App in your pocket Now!

Get it on Google Play Download on the App Store Now


Source:  OpenStax, Calculus volume 3. OpenStax CNX. Feb 05, 2016 Download for free at http://legacy.cnx.org/content/col11966/1.2
Google Play and the Google Play logo are trademarks of Google Inc.

Notification Switch

Would you like to follow the 'Calculus volume 3' conversation and receive update notifications?

Ask