| << Chapter < Page | Chapter >> Page > |
Plot , using the specified coefficients and ranges (use increments of 0.1):
a=2; b=.3; x=[0:.1:5]; y=a+b*x;plot(x,y),title('Graph of y=a+bx'),xlabel('x'),ylabel('y'),grid a=3; b=.0; x=[0:.1:10]; y=a+b*x;plot(x,y),title('Graph of y=a+bx'),xlabel('x'),ylabel('y'),grid a=2; b=.3; x=[0:.1:5]; y=a+b*x;plot(x,y),title('Graph of y=a+bx'),xlabel('x'),ylabel('y'),grid Plot the following functions, using increments of 0.01 and , , :
a=6; b=.8; x=[0:.01:5]; y=a+x.^b;plot(x,y),title('Graph of y=a+x^b'),xlabel('x'),ylabel('y'),grid

a=6; b=.8; x=[0:.01:5]; y=a*x.^b;plot(x,y),title('Graph of y=ax^b'),xlabel('x'),ylabel('y'),grid

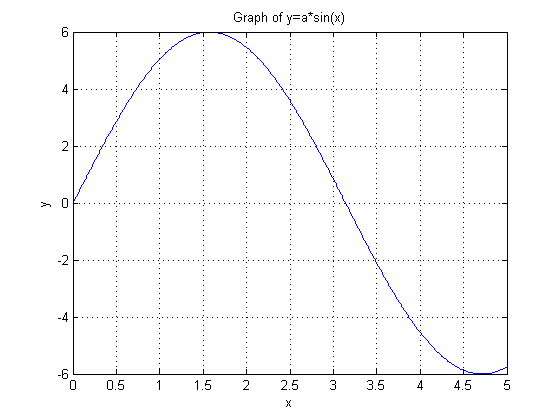
a=6; x=[0:.01:5]; y=a*sin(x);plot(x,y),title('Graph of y=a*sin(x)'),xlabel('x'),ylabel('y'),grid
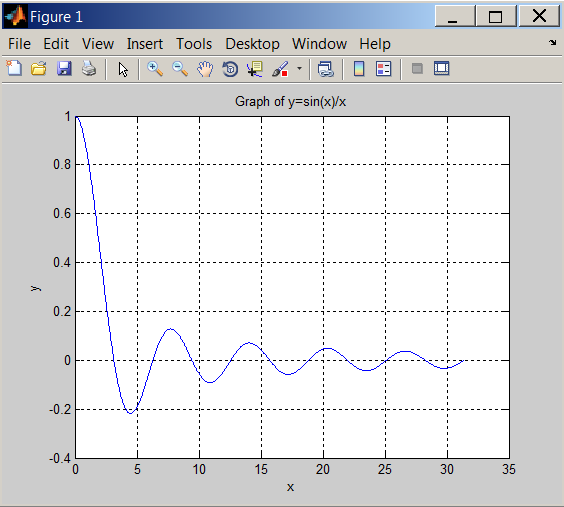
Plot function for using increments of
x = pi/100:pi/100:10*pi;
y = sin(x)./x;plot(x,y),title('Graph of y=sin(x)/x'),xlabel('x'),ylabel('y'),grid
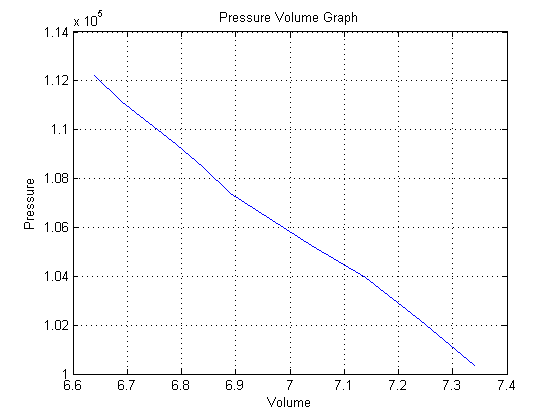
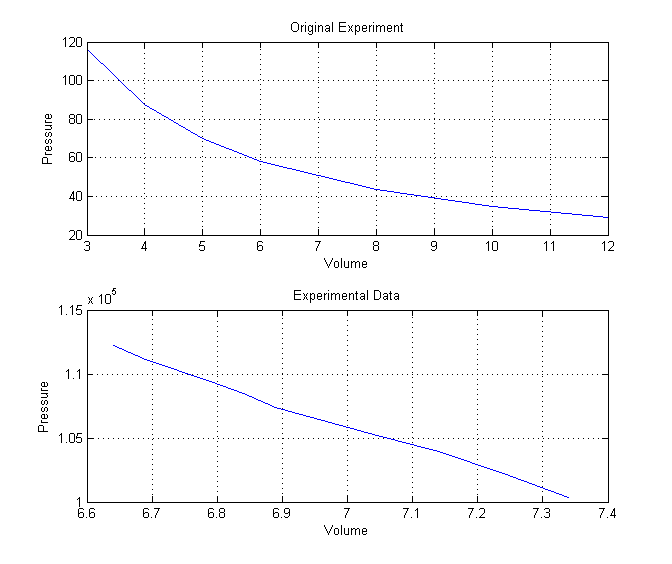
Data collected from Boyle's Law experiment are as follows: (Data available for download. )
| Volume [cm^3] | Pressure [Pa] |
|---|---|
| 7.34 | 100330 |
| 7.24 | 102200 |
| 7.14 | 103930 |
| 7.04 | 105270 |
| 6.89 | 107400 |
| 6.84 | 108470 |
| 6.79 | 109400 |
| 6.69 | 111140 |
| 6.64 | 112200 |
Pressure=[100330,102200,103930,105270,107400,108470,109400,111140,112200];Volume=[7.34,7.24,7.14,7.04,6.89,6.84,6.79,6.69,6.64];plot(Volume, Pressure),title('Pressure Volume Graph'),xlabel('Volume'),ylabel('Pressure'),grid
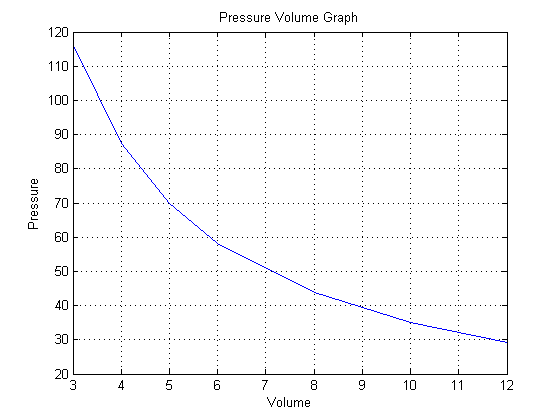
The original data collected from Boyle's Introduction to Engineering: Modeling and Problem Solving by J. B. Brockman, John Wiley and Sons, Inc. © 2009, (p.246) experiment are as follows: (Data available for download. )
| Volume [tube-inches] | Pressure [inches-Hg] |
|---|---|
| 12 | 29.125 |
| 10 | 35.000 |
| 8 | 43.688 |
| 6 | 58.250 |
| 5 | 70.000 |
| 4 | 87.375 |
| 3 | 116.500 |
>>P=[29.125,35,43.688,58.25,70,87.375,116.5];>>V=[12,10,8,6,5,4,3];>>plot(V,P),title('Pressure Volume Graph'),xlabel('Volume'),ylabel('Pressure'),grid
Display the two plots created earlier in one plot.
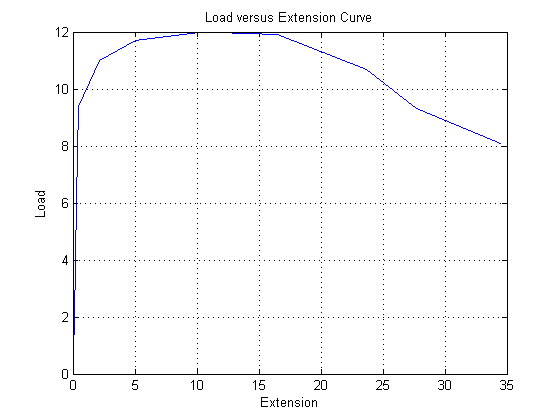
A tensile test of SAE 1020 steel produced the data below (Data available for download. ) Introduction to Materials Science for Engineers | Instructor's Manual by J. F. Shackelford, Macmillan Publishing Company. © 1992, (p.440) experiment are as follows:
| Extension [mm] | Load [kN] |
|---|---|
| 0.00 | 0.0 |
| 0.09 | 1.9 |
| 0.31 | 6.1 |
| 0.47 | 9.4 |
| 2.13 | 11.0 |
| 5.05 | 11.7 |
| 10.50 | 12.0 |
| 16.50 | 11.9 |
| 23.70 | 10.7 |
| 27.70 | 9.3 |
| 34.50 | 8.1 |
Extension=[0.00,0.09,0.31,0.47,2.13,5.05,10.50,16.50,23.70,27.70,34.50];Load=[0.0,1.9,6.1,9.4,11.0,11.7,12.0,11.9,10.7,9.3,8.1];plot(Extension, Load),title('Load versus Extension Curve'),xlabel('Extension'),ylabel('Load'),grid
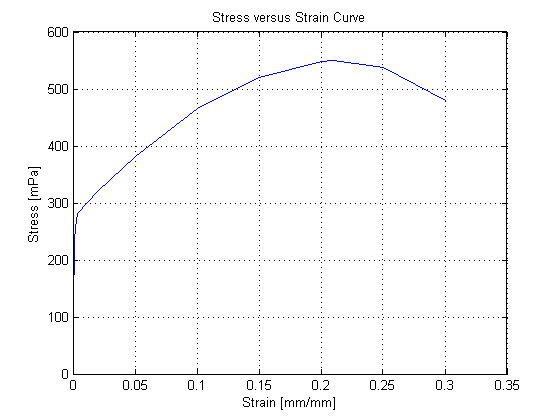
Given below is Stress-Strain data for a type 304 stainless steel. Introduction to Materials Science for Engineers by J. F. Shackelford, Macmillan Publishing Company. © 1985, (p.304) experiment are as follows: (Data available for download. )
| Stress [MPa] | Strain [mm/mm] |
|---|---|
| 0.0 | 0.0000 |
| 38.6 | 0.0002 |
| 77.2 | 0.0004 |
| 115.8 | 0.0006 |
| 154.4 | 0.0008 |
| 193.0 | 0.0010 |
| 218.0 | 0.0012 |
| 232.0 | 0.0014 |
| 258.0 | 0.0020 |
| 268.0 | 0.0025 |
| 273.0 | 0.0030 |
| 278.0 | 0.0035 |
| 282.0 | 0.0040 |
| 320.0 | 0.0200 |
| 382.0 | 0.0500 |
| 466.0 | 0.1000 |
| 520.0 | 0.1500 |
| 548.0 | 0.2000 |
| 550.0 | 0.2100 |
| 538.0 | 0.2500 |
| 480.0 | 0.3000 |
The data can be entered using Variable Editor:

Then execute the following:
plot(Strain,Stress),title('Stress versus Strain Curve'),xlabel('Strain [mm/mm]'),ylabel('Stress [mPa]'),grid

Notification Switch
Would you like to follow the 'A brief introduction to engineering computation with matlab' conversation and receive update notifications?