<< Chapter < Page Chapter >> Page >
  • Understand demographic measurements like fertility and mortality rates
  • Describe a variety of demographic theories, such as Malthusian, cornucopian, zero population growth, and demographic transition theories
  • Be familiar with current population trends and patterns
A street filled with people is shown here.
Earth’s population, which recently grew to 7 billion, is always on the move. (Photo courtesy of David Sim/flickr)

We recently hit a population milestone of seven billion humans on the earth’s surface. The rapidity with which this happened demonstrated an exponential increase from the time it took to grow from five billion to six billion people. In short, the planet is filling up. How quickly will we go from seven billion to eight billion? How will that population be distributed? Where is population the highest? Where is it slowing down? Where will people live? To explore these questions, we turn to demography    , or the study of populations. Three of the most important components affecting the issues above are fertility, mortality, and migration.

The fertility rate    of a society is a measure noting the number of children born. The fertility number is generally lower than the fecundity number, which measures the potential number of children that could be born to women of childbearing age. Sociologists measure fertility using the crude birthrate (the number of live births per 1,000 people per year). Just as fertility measures childbearing, the mortality rate    is a measure of the number of people who die. The crude death rate is a number derived from the number of deaths per 1,000 people per year. When analyzed together, fertility and mortality rates help researchers understand the overall growth occurring in a population.

Another key element in studying populations is the movement of people into and out of an area. Migration may take the form of immigration, which describes movement into an area to take up permanent residence, or emigration, which refers to movement out of an area to another place of permanent residence. Migration might be voluntary (as when college students study abroad), involuntary (as when Somalians left the drought and famine-stricken portion of their nation to stay in refugee camps), or forced (as when many Native American tribes were removed from the lands they’d lived in for generations).

Population growth

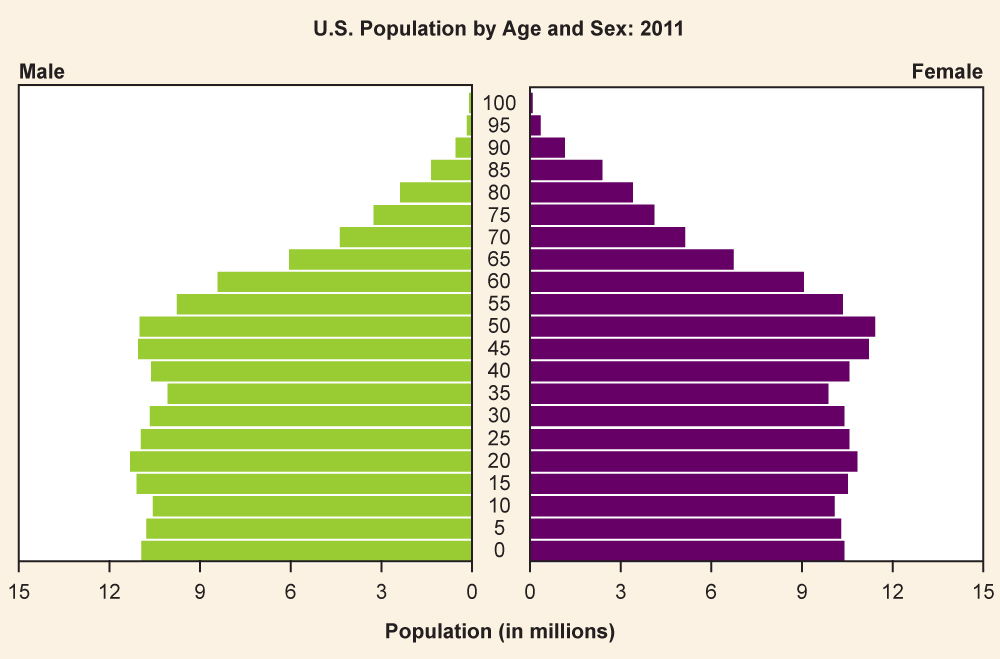
Changing fertility, mortality, and migration rates make up the total population composition    , a snapshot of the demographic profile of a population. This number can be measured for societies, nations, world regions, or other groups. The population composition includes the sex ratio    (the number of men for every hundred women) as well as the population pyramid    (a picture of population distribution by sex and age).

A pyramid graph depicting the 2011 population of the United States, grouped by age.
This population pyramid shows the breakdown of the 2010 American population according to age and sex. (Graph courtesy of Econ Proph blog and the U.S. Census Bureau)
As the table above illustrates, countries vary greatly in fertility rates and mortality rates—the components that make up a population composition. (Chart courtesy of CIA World Factbook 2011)
Varying fertility and mortality rated by country
Country Population (in millions) Fertility Rate Mortality Rate Sex Ratio Male to Female
Afghanistan 29.8 5.4% 17.4% 1.05
Sweden 9.1 1.7% 10.2% 0.98
United States of America 313.2 2.1% 8.4% 0.97

Questions & Answers

how do you get the 2/50
Abba Reply
number of sport play by 50 student construct discrete data
Aminu Reply
width of the frangebany leaves on how to write a introduction
Theresa Reply
Solve the mean of variance
Veronica Reply
Step 1: Find the mean. To find the mean, add up all the scores, then divide them by the number of scores. ... Step 2: Find each score's deviation from the mean. ... Step 3: Square each deviation from the mean. ... Step 4: Find the sum of squares. ... Step 5: Divide the sum of squares by n – 1 or N.
kenneth
what is error
Yakuba Reply
Is mistake done to something
Vutshila
Hy
anas
hy
What is the life teble
anas
hy
Jibrin
statistics is the analyzing of data
Tajudeen Reply
what is statics?
Zelalem Reply
how do you calculate mean
Gloria Reply
diveving the sum if all values
Shaynaynay
let A1,A2 and A3 events be independent,show that (A1)^c, (A2)^c and (A3)^c are independent?
Fisaye Reply
what is statistics
Akhisani Reply
data collected all over the world
Shaynaynay
construct a less than and more than table
Imad Reply
The sample of 16 students is taken. The average age in the sample was 22 years with astandard deviation of 6 years. Construct a 95% confidence interval for the age of the population.
Aschalew Reply
Bhartdarshan' is an internet-based travel agency wherein customer can see videos of the cities they plant to visit. The number of hits daily is a normally distributed random variable with a mean of 10,000 and a standard deviation of 2,400 a. what is the probability of getting more than 12,000 hits? b. what is the probability of getting fewer than 9,000 hits?
Akshay Reply
Bhartdarshan'is an internet-based travel agency wherein customer can see videos of the cities they plan to visit. The number of hits daily is a normally distributed random variable with a mean of 10,000 and a standard deviation of 2,400. a. What is the probability of getting more than 12,000 hits
Akshay
1
Bright
Sorry i want to learn more about this question
Bright
Someone help
Bright
a= 0.20233 b=0.3384
Sufiyan
a
Shaynaynay
How do I interpret level of significance?
Mohd Reply
It depends on your business problem or in Machine Learning you could use ROC- AUC cruve to decide the threshold value
Shivam
how skewness and kurtosis are used in statistics
Owen Reply
yes what is it
Taneeya
Got questions? Join the online conversation and get instant answers!
Jobilize.com Reply

Get Jobilize Job Search Mobile App in your pocket Now!

Get it on Google Play Download on the App Store Now


Source:  OpenStax, Introduction to sociology. OpenStax CNX. Jun 12, 2012 Download for free at https://legacy.cnx.org/content/col11407/1.7
Google Play and the Google Play logo are trademarks of Google Inc.

Notification Switch

Would you like to follow the 'Introduction to sociology' conversation and receive update notifications?

Ask