<< Chapter < Page Chapter >> Page >
  • Identify a cylinder as a type of three-dimensional surface.
  • Recognize the main features of ellipsoids, paraboloids, and hyperboloids.
  • Use traces to draw the intersections of quadric surfaces with the coordinate planes.

We have been exploring vectors and vector operations in three-dimensional space, and we have developed equations to describe lines, planes, and spheres. In this section, we use our knowledge of planes and spheres, which are examples of three-dimensional figures called surfaces , to explore a variety of other surfaces that can be graphed in a three-dimensional coordinate system.

Identifying cylinders

The first surface we’ll examine is the cylinder. Although most people immediately think of a hollow pipe or a soda straw when they hear the word cylinder , here we use the broad mathematical meaning of the term. As we have seen, cylindrical surfaces don’t have to be circular. A rectangular heating duct is a cylinder, as is a rolled-up yoga mat, the cross-section of which is a spiral shape.

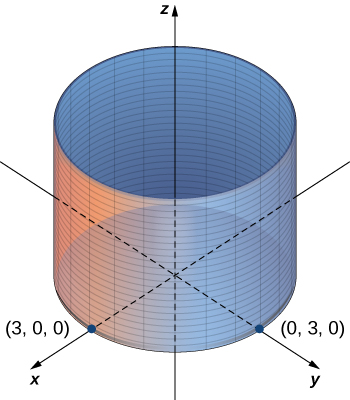
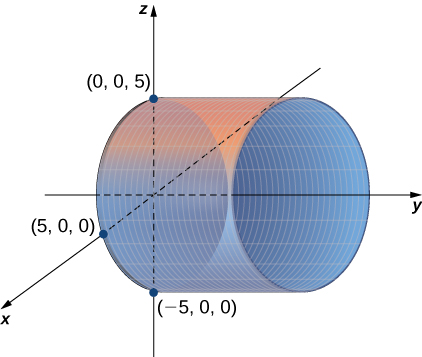
In the two-dimensional coordinate plane, the equation x 2 + y 2 = 9 describes a circle centered at the origin with radius 3 . In three-dimensional space, this same equation represents a surface. Imagine copies of a circle stacked on top of each other centered on the z -axis ( [link] ), forming a hollow tube. We can then construct a cylinder from the set of lines parallel to the z -axis passing through circle x 2 + y 2 = 9 in the xy -plane, as shown in the figure. In this way, any curve in one of the coordinate planes can be extended to become a surface.

This figure a 3-dimensional coordinate system. It has a right circular center with the z-axis through the center. The cylinder also has points labeled on the x and y axis at (3, 0, 0) and (0, 3, 0).
In three-dimensional space, the graph of equation x 2 + y 2 = 9 is a cylinder with radius 3 centered on the z -axis. It continues indefinitely in the positive and negative directions.

Definition

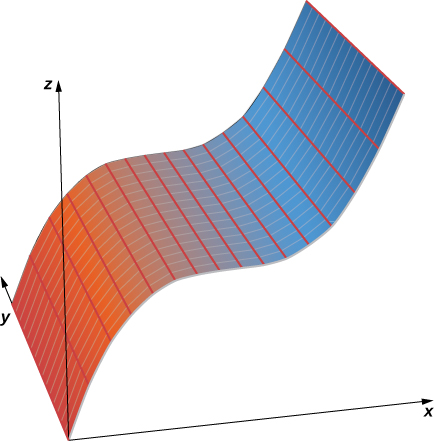
A set of lines parallel to a given line passing through a given curve is known as a cylindrical surface, or cylinder    . The parallel lines are called rulings    .

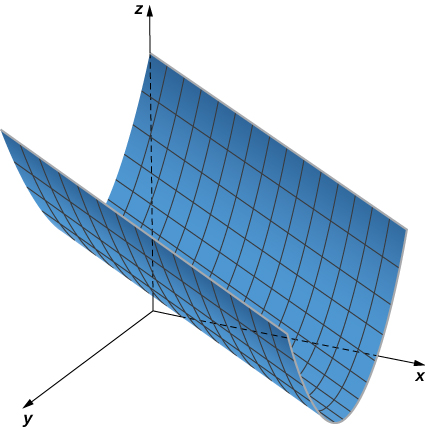
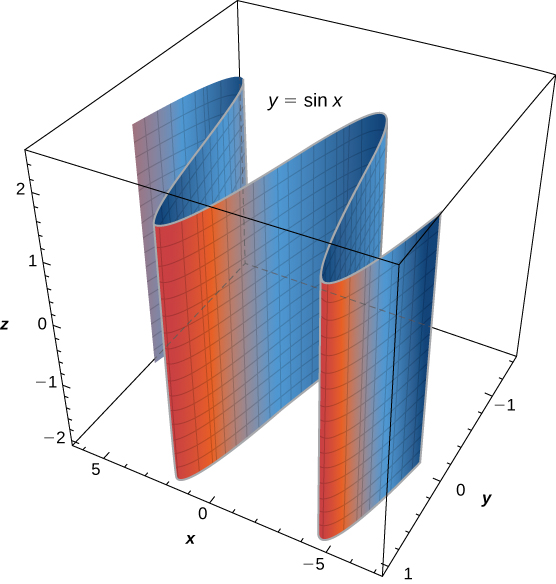
From this definition, we can see that we still have a cylinder in three-dimensional space, even if the curve is not a circle. Any curve can form a cylinder, and the rulings that compose the cylinder may be parallel to any given line ( [link] ).

This figure has a 3-dimensional surface that begins on the y-axis and curves upward. There is also the x and z axes labeled.
In three-dimensional space, the graph of equation z = x 3 is a cylinder, or a cylindrical surface with rulings parallel to the y -axis.

Graphing cylindrical surfaces

Sketch the graphs of the following cylindrical surfaces.

  1. x 2 + z 2 = 25
  2. z = 2 x 2 y
  3. y = sin x
  1. The variable y can take on any value without limit. Therefore, the lines ruling this surface are parallel to the y -axis. The intersection of this surface with the xz -plane forms a circle centered at the origin with radius 5 (see the following figure).
    This figure is the 3-dimensional coordinate system. It has a right circular cylinder on its side with the y-axis in the center. The cylinder intersects the x-axis at (5, 0, 0). It also has two points of intersection labeled on the z-axis at (0, 0, 5) and (0, 0, -5).
    The graph of equation x 2 + z 2 = 25 is a cylinder with radius 5 centered on the y -axis.
  2. In this case, the equation contains all three variables x , y , and z so none of the variables can vary arbitrarily. The easiest way to visualize this surface is to use a computer graphing utility (see the following figure).
    This figure has a surface in the first octant. The cross section of the solid is a parabola.
  3. In this equation, the variable z can take on any value without limit. Therefore, the lines composing this surface are parallel to the z -axis. The intersection of this surface with the yz -plane outlines curve y = sin x (see the following figure).
    This figure is a three dimensional surface. A cross section of the surface parallel to the x y plane would be the sine curve.
    The graph of equation y = sin x is formed by a set of lines parallel to the z -axis passing through curve y = sin x in the xy -plane.
Got questions? Get instant answers now!

Questions & Answers

differentiate between demand and supply giving examples
Lambiv Reply
differentiated between demand and supply using examples
Lambiv
what is labour ?
Lambiv
how will I do?
Venny Reply
how is the graph works?I don't fully understand
Rezat Reply
information
Eliyee
devaluation
Eliyee
t
WARKISA
hi guys good evening to all
Lambiv
multiple choice question
Aster Reply
appreciation
Eliyee
explain perfect market
Lindiwe Reply
In economics, a perfect market refers to a theoretical construct where all participants have perfect information, goods are homogenous, there are no barriers to entry or exit, and prices are determined solely by supply and demand. It's an idealized model used for analysis,
Ezea
What is ceteris paribus?
Shukri Reply
other things being equal
AI-Robot
When MP₁ becomes negative, TP start to decline. Extuples Suppose that the short-run production function of certain cut-flower firm is given by: Q=4KL-0.6K2 - 0.112 • Where is quantity of cut flower produced, I is labour input and K is fixed capital input (K-5). Determine the average product of lab
Kelo
Extuples Suppose that the short-run production function of certain cut-flower firm is given by: Q=4KL-0.6K2 - 0.112 • Where is quantity of cut flower produced, I is labour input and K is fixed capital input (K-5). Determine the average product of labour (APL) and marginal product of labour (MPL)
Kelo
yes,thank you
Shukri
Can I ask you other question?
Shukri
what is monopoly mean?
Habtamu Reply
What is different between quantity demand and demand?
Shukri Reply
Quantity demanded refers to the specific amount of a good or service that consumers are willing and able to purchase at a give price and within a specific time period. Demand, on the other hand, is a broader concept that encompasses the entire relationship between price and quantity demanded
Ezea
ok
Shukri
how do you save a country economic situation when it's falling apart
Lilia Reply
what is the difference between economic growth and development
Fiker Reply
Economic growth as an increase in the production and consumption of goods and services within an economy.but Economic development as a broader concept that encompasses not only economic growth but also social & human well being.
Shukri
production function means
Jabir
What do you think is more important to focus on when considering inequality ?
Abdisa Reply
any question about economics?
Awais Reply
sir...I just want to ask one question... Define the term contract curve? if you are free please help me to find this answer 🙏
Asui
it is a curve that we get after connecting the pareto optimal combinations of two consumers after their mutually beneficial trade offs
Awais
thank you so much 👍 sir
Asui
In economics, the contract curve refers to the set of points in an Edgeworth box diagram where both parties involved in a trade cannot be made better off without making one of them worse off. It represents the Pareto efficient allocations of goods between two individuals or entities, where neither p
Cornelius
In economics, the contract curve refers to the set of points in an Edgeworth box diagram where both parties involved in a trade cannot be made better off without making one of them worse off. It represents the Pareto efficient allocations of goods between two individuals or entities,
Cornelius
Suppose a consumer consuming two commodities X and Y has The following utility function u=X0.4 Y0.6. If the price of the X and Y are 2 and 3 respectively and income Constraint is birr 50. A,Calculate quantities of x and y which maximize utility. B,Calculate value of Lagrange multiplier. C,Calculate quantities of X and Y consumed with a given price. D,alculate optimum level of output .
Feyisa Reply
Answer
Feyisa
c
Jabir
the market for lemon has 10 potential consumers, each having an individual demand curve p=101-10Qi, where p is price in dollar's per cup and Qi is the number of cups demanded per week by the i th consumer.Find the market demand curve using algebra. Draw an individual demand curve and the market dema
Gsbwnw Reply
suppose the production function is given by ( L, K)=L¼K¾.assuming capital is fixed find APL and MPL. consider the following short run production function:Q=6L²-0.4L³ a) find the value of L that maximizes output b)find the value of L that maximizes marginal product
Abdureman
types of unemployment
Yomi Reply
What is the difference between perfect competition and monopolistic competition?
Mohammed
Got questions? Join the online conversation and get instant answers!
Jobilize.com Reply
Practice Key Terms 9

Get Jobilize Job Search Mobile App in your pocket Now!

Get it on Google Play Download on the App Store Now


Source:  OpenStax, Calculus volume 3. OpenStax CNX. Feb 05, 2016 Download for free at http://legacy.cnx.org/content/col11966/1.2
Google Play and the Google Play logo are trademarks of Google Inc.

Notification Switch

Would you like to follow the 'Calculus volume 3' conversation and receive update notifications?

Ask