

| << Chapter < Page | Chapter >> Page > |
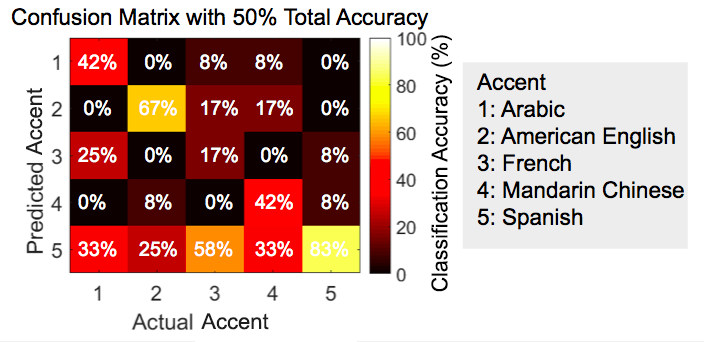
Confusion matrices are used to analyze the results of the full testing runs. A confusion matrix, also known as an error matrix, gives a visual representation of the performance of a learning algorithm--in our case, using scattering coefficients to train an SVM. Each entry in the matrix corresponds to the predicted accent versus the actual accent, with entries along the diagonal representing correctly predicted accents. While no column contained perfect classification accuracy, we were still able to correctly classify four out of five of the accents. We found that the overall accuracy of the confusion matrix was 50%, with a high misclassification of French as Spanish. We found an overall tendency for languages to be classified as Spanish, which we believe is due to the diversity of the Spanish accent sound samples. The accent database had fewer Spanish accent samples than the other four languages so the samples included speakers from many Spanish speaking countries. The diversity in the Spanish accent sound samples might have led to the high rates of misclassification as Spanish observed.
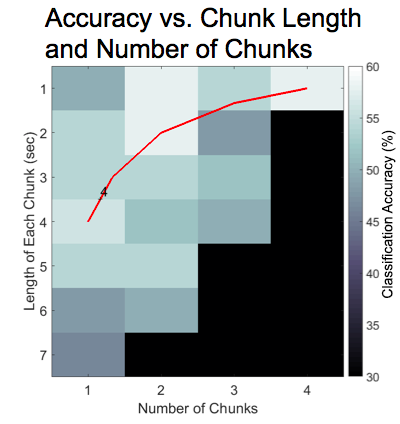
When tuning the input data parameters — the number of chunks and the length of each chunk — we found that, in general, having two total chunks resulted in the best performance. Furthermore, the system performed well when the total time of the sound analyzed — the length of each chunk times the number of chunks — was four seconds, a trend which is highlighted in red on the graph. We hypothesize that this occurs because the sound clips are relatively synchronized up until four seconds, with the pace of the speaker being increasingly significant afterwards. We applied these results to later tests by using a pair of two second chunks as the input data parameters.
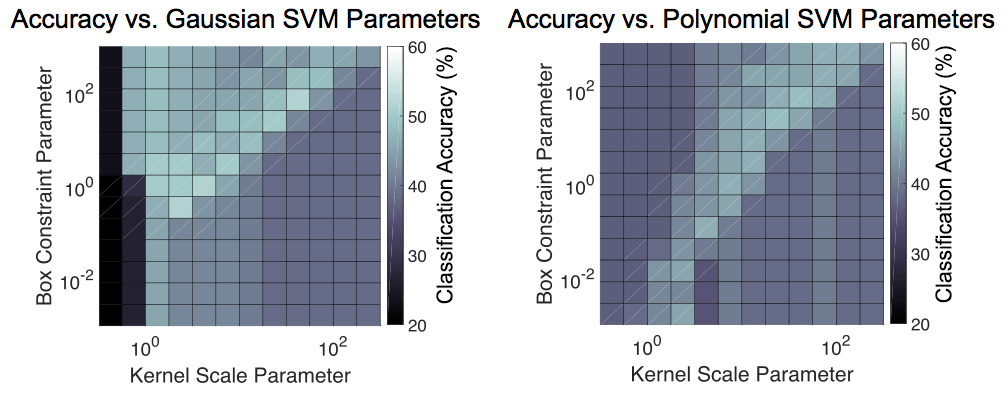
Through testing combinations of box constraint and kernel scale parameters for linear, gaussian, and polynomial support vector machine models, we were able to determine the optimal parameters for classification accuracy. We found that the linear model produced far worse results than the gaussian and polynomial models and eliminated it from further analysis. The gaussian model had better overall accuracy compared to the polynomial model, so we chose our ideal testing parameters to be in the range of its lightest squares — corresponding to about 50% accuracy. These parameters were used to produce the confusion matrix seen earlier.
Notification Switch
Would you like to follow the 'Elec 301 projects fall 2015' conversation and receive update notifications?

|
|

|
|

|
|

|
|

|
|

|
|

|
|

|
|

|
|

|