<< Chapter < Page Chapter >> Page >
This module gives the need for greater frequency spectrum allocation for Mobile Communication and this has to be fulfilled within 350MHz to 3.5GHz considerable fraction of which is already occupied for TV usage.Hence ways and means have to be devised so that greater portion of this opportunity window is freed for Mobile Applications.

FREQUENCY SPECTRUM ALLOCATION IN 21 st Century.

(Adapted from ’ The Great Spectrum Famine’ by Mitchell Lazarus, Spectrum , November, 2010)

Table 1. The Opportunity Window: The best frequencies for mobile broadband are high enough that the antenna can be made conveniently compact and yet not so high that it fails to penetrate the buildings. This leaves a relatively narrow range of frequencies available for use i.e. from 300MHz to 3.5GHz..

Best for Mobile Broadband300Mz to 3.5GHz
Spectrum Slot 1MHz-10MHz 10MHz-100MHz 100MHz-1GHz 1GHz-10GHz
Size of efficientantenna 75m to 7.5m 7.5m to 0.75m 0.75m to7.5cm 7.5cm to 7.5mm
Bounces from the skyDue to ionosphericreflections Bounces inside the room
Penetrates buildings and terrain Reflects from buildings
Follows Earth’scurvature Travels along line-of-sight

It is a World Wide Worry:

“The growing popularity of mobile broadband is a global phenomenon, and the laws of physics that limit the frequencies available for it are the same everywhere. So it is no surprise that many other countries are facing the same spectrum famine as the United States.

All regions have large amounts of spectrum dedicated to TV, most of it in the frequency range suitable for wireless broadband. Most countries have targeted a conversion to digital broadcast TV as their best bet obtaining more wireless spectrum- what the European Union calls a digital “dividend”.Several have already completed the transition, including Belgium, Denmark, Finland, Germany, Luxembourg, the Netherlands, Norway, Spain, Sweden and Switzerland. Other countries have transition in progress, most scheduled for completion between 2011 and 2013 (China in 2015). The amounts of spectrum harvested by this transition vary from about 100 to 130MHz.

Many countries are also experimenting with spectrum auctions, some with a minimum of regiulation of the technologies, as a way of fostering efficient use.”

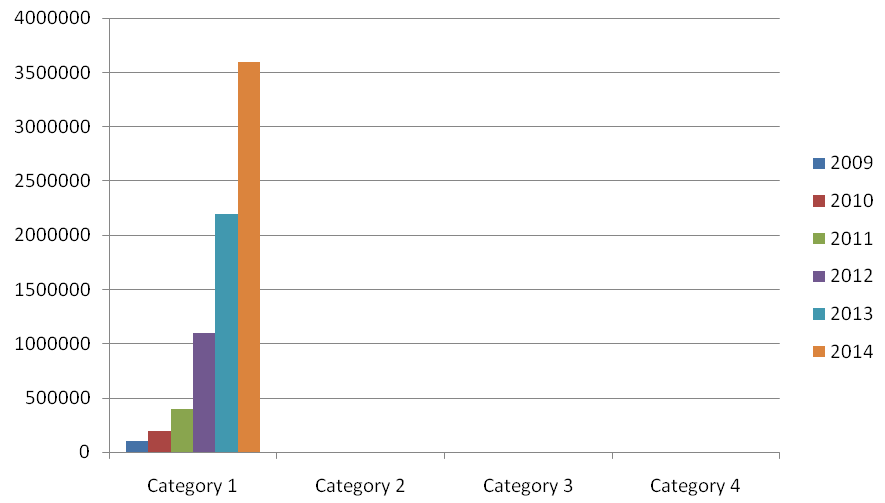
Figure 1.Mobile Broadband Skyrockets Globally.(Source Cisco)

[X-axis Year; Y-axis Terabytes per month.

Terabytes per month includes Voice over Internet Protocol, Gaming, Peer-to Peer networking, Web/data, Video.

In the year 2014 it is projected that Voice over Internet Protocol (4%), Gaming(6%), Peer-to Peer networking(8%), Web/data(17%), Video(66%).]

Evolution of Mobile Phone Service:

1970s- One transmitter was used to serve the whole city.There were a few dozen voice channels and these channels were shared among the thousands of user in time. Because of time sharing, there were long waits and calls were expensive.

1980s-832 pairs of 30 kHz spaced analog FM channels in the 800-MHz band. These were reused in the cellular layout at different locations across the city to support many thousands of conversations. But service charges were out of reach for the common man.

1990- 1.9-GHz “2G” voice service came in vogue. The service providers used auctioned spectrum for digital transmission which yielded great benefits in terms of quality of voice transmission as well as in terms of efficient use of the spectrum. This was enabled because digital communication has the advantage of error detection and correction as well as it has the advantage of band-width compression.

By the time we entered 21 st century, all mobile transmissions had converted to digital transmission resulting in tenfold increase in capacity of the wireless networks.

Transition from Analog to Digital Communication.

The transition from analog to digital mobile phone was smooth and voluntary. Service providers made the change on their own, for their own benefit and on their own time-tables.

The transition from analog TV to digtal TV was slow and painful and in USA it was completed by 2009. But this transition eventually yielded 108MHz of spectrum which were freed for auction to mobile service providers. Now each digtal TV station can accommodate four analog-quality video signals and it has the new options for high definition programming and data services. This results in fivefold improvement in spectrum efficiency.

Ways and means for overcoming this spectrum famine.

  1. Identify the least efficient or least critical services and redesign them to use less spectrum. The collective traffic of police, fire-fighters, emergency responders, utility workers, taxi drivers, plumbers, construction crews and their like can be handled in far less spectrum;
  2. Underused mobile satellite bands need to be converted to a primarily terrestrial cellphone-type service;
  3. Government keeps large swaths of valuable spectrum. This could be fred for private use.
  4. Rapid switch to digital TV is going to yield high dividends.

Questions & Answers

differentiate between demand and supply giving examples
Lambiv Reply
differentiated between demand and supply using examples
Lambiv
what is labour ?
Lambiv
how will I do?
Venny Reply
how is the graph works?I don't fully understand
Rezat Reply
information
Eliyee
devaluation
Eliyee
t
WARKISA
hi guys good evening to all
Lambiv
multiple choice question
Aster Reply
appreciation
Eliyee
explain perfect market
Lindiwe Reply
In economics, a perfect market refers to a theoretical construct where all participants have perfect information, goods are homogenous, there are no barriers to entry or exit, and prices are determined solely by supply and demand. It's an idealized model used for analysis,
Ezea
What is ceteris paribus?
Shukri Reply
other things being equal
AI-Robot
When MP₁ becomes negative, TP start to decline. Extuples Suppose that the short-run production function of certain cut-flower firm is given by: Q=4KL-0.6K2 - 0.112 • Where is quantity of cut flower produced, I is labour input and K is fixed capital input (K-5). Determine the average product of lab
Kelo
Extuples Suppose that the short-run production function of certain cut-flower firm is given by: Q=4KL-0.6K2 - 0.112 • Where is quantity of cut flower produced, I is labour input and K is fixed capital input (K-5). Determine the average product of labour (APL) and marginal product of labour (MPL)
Kelo
yes,thank you
Shukri
Can I ask you other question?
Shukri
what is monopoly mean?
Habtamu Reply
What is different between quantity demand and demand?
Shukri Reply
Quantity demanded refers to the specific amount of a good or service that consumers are willing and able to purchase at a give price and within a specific time period. Demand, on the other hand, is a broader concept that encompasses the entire relationship between price and quantity demanded
Ezea
ok
Shukri
how do you save a country economic situation when it's falling apart
Lilia Reply
what is the difference between economic growth and development
Fiker Reply
Economic growth as an increase in the production and consumption of goods and services within an economy.but Economic development as a broader concept that encompasses not only economic growth but also social & human well being.
Shukri
production function means
Jabir
What do you think is more important to focus on when considering inequality ?
Abdisa Reply
any question about economics?
Awais Reply
sir...I just want to ask one question... Define the term contract curve? if you are free please help me to find this answer 🙏
Asui
it is a curve that we get after connecting the pareto optimal combinations of two consumers after their mutually beneficial trade offs
Awais
thank you so much 👍 sir
Asui
In economics, the contract curve refers to the set of points in an Edgeworth box diagram where both parties involved in a trade cannot be made better off without making one of them worse off. It represents the Pareto efficient allocations of goods between two individuals or entities, where neither p
Cornelius
In economics, the contract curve refers to the set of points in an Edgeworth box diagram where both parties involved in a trade cannot be made better off without making one of them worse off. It represents the Pareto efficient allocations of goods between two individuals or entities,
Cornelius
Suppose a consumer consuming two commodities X and Y has The following utility function u=X0.4 Y0.6. If the price of the X and Y are 2 and 3 respectively and income Constraint is birr 50. A,Calculate quantities of x and y which maximize utility. B,Calculate value of Lagrange multiplier. C,Calculate quantities of X and Y consumed with a given price. D,alculate optimum level of output .
Feyisa Reply
Answer
Feyisa
c
Jabir
the market for lemon has 10 potential consumers, each having an individual demand curve p=101-10Qi, where p is price in dollar's per cup and Qi is the number of cups demanded per week by the i th consumer.Find the market demand curve using algebra. Draw an individual demand curve and the market dema
Gsbwnw Reply
suppose the production function is given by ( L, K)=L¼K¾.assuming capital is fixed find APL and MPL. consider the following short run production function:Q=6L²-0.4L³ a) find the value of L that maximizes output b)find the value of L that maximizes marginal product
Abdureman
types of unemployment
Yomi Reply
What is the difference between perfect competition and monopolistic competition?
Mohammed
Got questions? Join the online conversation and get instant answers!
Jobilize.com Reply

Get Jobilize Job Search Mobile App in your pocket Now!

Get it on Google Play Download on the App Store Now


Source:  OpenStax, Solid state physics and devices-the harbinger of third wave of civilization. OpenStax CNX. Sep 15, 2014 Download for free at http://legacy.cnx.org/content/col11170/1.89
Google Play and the Google Play logo are trademarks of Google Inc.

Notification Switch

Would you like to follow the 'Solid state physics and devices-the harbinger of third wave of civilization' conversation and receive update notifications?

Ask