

| << Chapter < Page | Chapter >> Page > |
The smallest data value is 60. Since the data with the most decimal places has one decimal (for instance, 61.5), we want our starting point to have two decimal places. Since the numbers 0.5, 0.05, 0.005, etc. are convenient numbers, use 0.05 and subtract it from 60, the smallest value, for the convenient starting point.
60 - 0.05 = 59.95 which is more precise than, say, 61.5 by one decimal place. The starting point is, then, 59.95.
The largest value is 74. 74+ 0.05 = 74.05 is the ending value.
Next, calculate the width of each bar or class interval. To calculate this width, subtract the starting point from the ending value and divide by the number of bars (you must choose the number of bars you desire). Suppose you choose 8 bars.
The boundaries are:
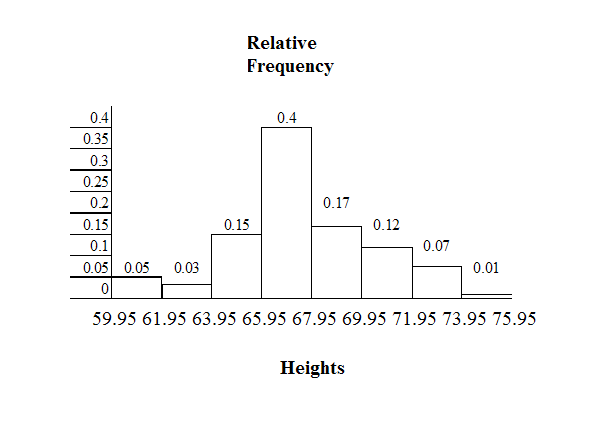
The heights 60 through 61.5 inches are in the interval 59.95 - 61.95. The heights that are 63.5 are in the interval 61.95 - 63.95. The heights that are 64 through 64.5 are in the interval 63.95 - 65.95. The heights 66 through 67.5 are in the interval 65.95 - 67.95. The heights 68 through 69.5 are in the interval 67.95 - 69.95. The heights 70 through 71 are in the interval 69.95 - 71.95. The heights 72 through 73.5 are in the interval 71.95 - 73.95. The height 74 is in the interval 73.95 - 75.95.
The following histogram displays the heights on the x-axis and relative frequency on the y-axis.
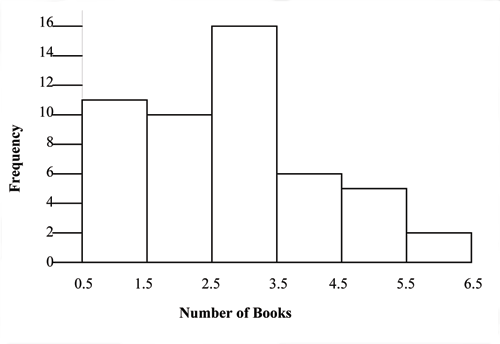
The following data are the number of books bought by 50 part-time college students at ABC College. The number of books is discrete data since books are counted.
Eleven students buy 1 book. Ten students buy 2 books. Sixteen students buy 3 books. Six students buy 4 books. Five students buy 5 books. Two students buy 6 books.
Because the data are integers, subtract 0.5 from 1, the smallest data value and add 0.5 to 6, the largest data value. Then the starting point is 0.5 and the ending value is 6.5.
Next, calculate the width of each bar or class interval. If the data are discrete and there are not too many different values, a width that places the data values in the middle of the bar or class interval is the most convenient. Since the data consist of the numbers 1, 2, 3, 4, 5, 6 and the starting point is 0.5, a width of one places the 1 in the middle of the interval from 0.5 to 1.5, the 2 in the middle of the interval from 1.5 to 2.5, the 3 in the middle of the interval from 2.5 to 3.5, the 4 in the middle of the interval from _______ to _______, the 5 in the middle of the interval from _______ to _______, and the _______ in the middle of the interval from _______ to _______ .
Calculate the number of bars as follows:
where 1 is the width of a bar. Therefore, .
The following histogram displays the number of books on the x-axis and the frequency on the y-axis.
Count the money (bills and change) in your pocket or purse. Your instructor will record the amounts. As a class, construct a histogram displaying the data. Discuss how many intervals you think is appropriate. You may want to experiment with the number of intervals. Discuss, also, the shape of the histogram.
Record the data, in dollars (for example, 1.25 dollars).
Construct a histogram.
Notification Switch
Would you like to follow the 'Collaborative statistics using spreadsheets' conversation and receive update notifications?

|
|

|
|
|
|
|

|
|

|
|

|
|

|
|

|
|

|
|

|