The learning programme for grade six consists of five modules:
1. Number concept, Addition and Subtraction
2. Multiplication and Division
3. Fractions and Decimal fractions
4. Measurement and Time
5. Geometry; Data handling and Probability
It is important that educators complete the modules in the above sequence, as the learners will require the knowledge and skills acquired through a previous module to be able to do the work in any subsequent module.
COMMON AND DECIMAL FRACTIONS (LO 1; 2 AND 5)
LEARNING UNIT 1 FOCUSES ON COMMON FRACTIONS
This module continues the work dealt with in grade 5. Addition and subtraction of fractions are extended and calculation of a fraction of a particular amount is revised.
Check whether the learners know the correct terminology and are able to use the correct strategies for doing the above correctly.
Critical outcome 5 (Communicating effectively by using visual, symbolic and /or language skills in a variety of ways) is addressed.
It should be possible to work through the module in 3 weeks.
** Activity 17 is designed as a portfolio task. It is a very simple task, but learners should do it neatly and accurately. They must be informed in advance of how the educator will be assessing the work.
LEARNING UNIT 2 FOCUSES ON DECIMAL FRACTIONS
This module extends the work that was done in grade 5. Learners should be able to do rounding of decimal fractions to the nearest tenth, hundredth and thousandth. Emphasise the use of the correct method (vertical) for addition and subtraction. Also spend sufficient time on the multiplication and division of decimal fractions.
As learners usually have difficulty with the latter, you could allow 3 to 4 weeks for this section of the work.
** Activity 19 is a task for the portfolio. The assignment is fairly simple, but learners should complete it neatly and accurately. They must be informed in advance of how the educator will be assessing the work.
1.1
a)
1
b)
c)
d)
e)
1.2
a)
b)
c)
d)
e)
f)
g)
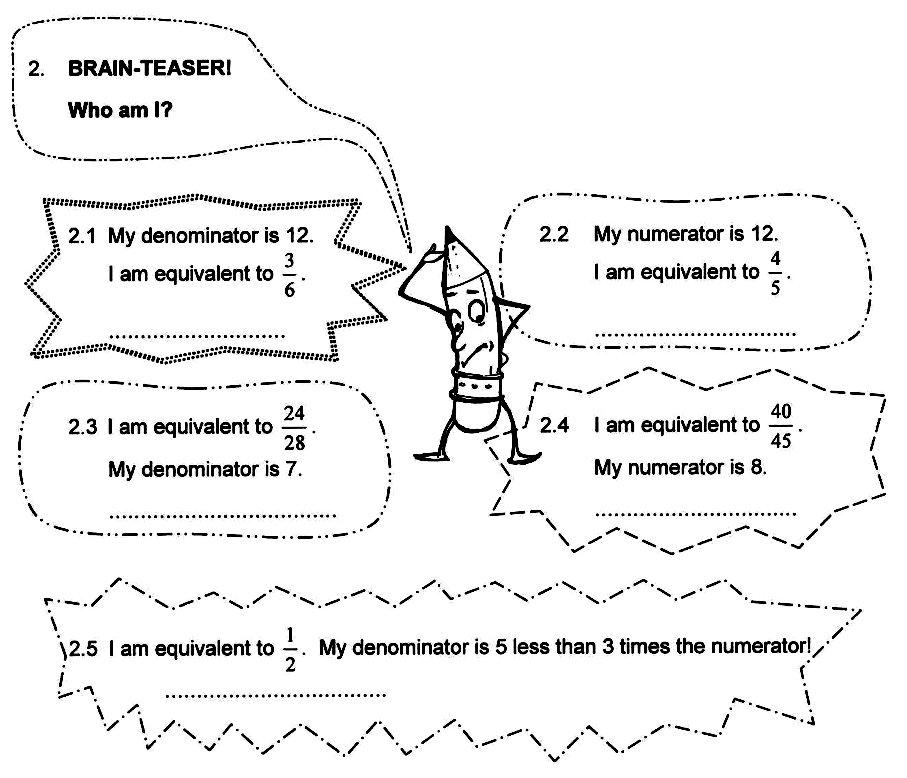
2.
BRAIN TEASER!
2.1
2.2
2.3
2.4
2.5
3.
>
3.2<
=
3.4<
3.5 First make denominators the same
4.
5.
<
5.2>
5.3 First find common denominator
6.
63
6.2 20
18
6.4 40
6.5 10
7.
7.1
7.2
7.3
Leaner section
Content
Activity: to recognise and classify numbers in order to describe and compare them [lo 1.3.3]
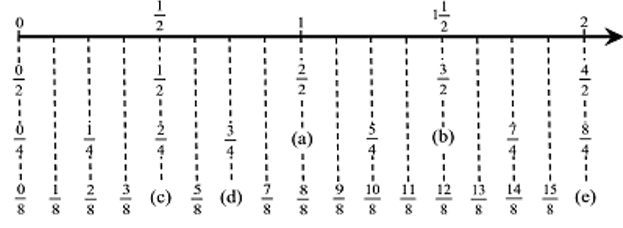
We have looked at fractions on a number line in earlier grades. When they are positioned as clearly as they are on the number line below, it is child’s play to compare them with each other and determine which are equivalent, which are larger or which are smaller than a given fraction. Here we have a few exercises to see if you are able to apply your knowledge of equivalent fractions correctly.
1. Examine the following diagram.
1.1 Write down the fractions that are missing:
a) ………………………………………………..
b) ………………………………………………..
c) ………………………………………………..
d) ………………………………………………..
e) ………………………………………………..
1.2 Write equivalent fractions for:
a)
………………………………………………..
b)
………………………………………………..
c)
………………………………………………..
d)
………………………………………………..
e)
………………………………………………..
f)
………………………………………………..
g)
………………………………………………..
3. Fill in:<;>or = :
3.1
...............
3.2
...............
3.3
...............
3.4
...............
3.5 Are you able to explain how you found the answers?
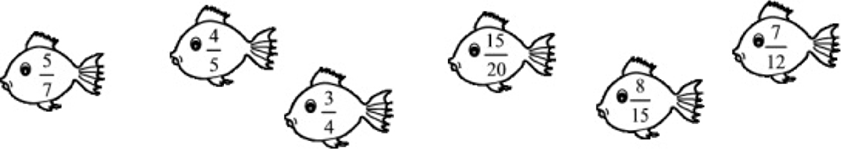
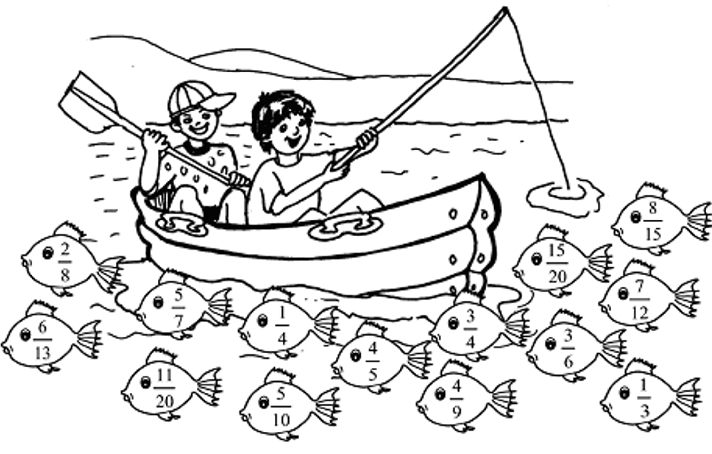
4. Help to “catch” all the fish that have a value above
by colouring them in neatly.
5. Work with a friend and fill in:<;>or = :
5.1
...............
5.2
...............
5.3 Explain to the rest of the class how you arrived at the answer.
6. Complete the following table:
FRACTIONS
COMMON DENOMINATOR
E.g.
,
6
6.1
,
6.2
,
6.3
,
6.4
,
6.5
,
7. Draw a circle round the smallest fraction:
7.1
,
7.2
,
7.3
,
Time for self-assessment
How have you managed up to now? Are you ready for the next section of the work? Assess yourself on a scale of 1 - 4 to show us how you are coping:
= needs attention
2 = fairly good3 = very good
4 = outstanding
CRITERIA
CODE
I could match the words to the correct explanation on p. 3.
1
2
3
4
I could answer no. 1 of Activity 1.1 correctly.
1
2
3
4
I could find the proper fractions in no. 3. (LO 1.3)
I could find the improper fractions in no. 3. (LO 1.3)
1
2
3
4
I could find the mixed numbers in no. 3. (LO 1.3)
1
2
3
4
I could complete the table correctly in no. 4. (LO 1.3)
1
2
3
4
I could explain what equivalent fractions are. (LO 1.8)
1
2
3
4
I could correctly indicate my own equivalent fractions for
in no. 5.2. (LO 1.8)
1
2
3
4
I could also write down equivalent fractions for other fractions (no. 6).
1
2
3
4
I could fill in relationship signs correctly.
1
2
3
4
Assessment
Learning Outcome 1: The learner will be able to recognise, describe and represent numbers and their relationships, and to count, estimate, calculate and check with competence and confidence in solving problems.
Assessment Standard 1.3: We know this when the learner recognises and represents the following numbers in order to describe and compare them:
1.3.3 common fractions, including specifically tenths, hundreds and percentages.
Questions & Answers
differentiate between demand and supply
giving examples
In economics, a perfect market refers to a theoretical construct where all participants have perfect information, goods are homogenous, there are no barriers to entry or exit, and prices are determined solely by supply and demand. It's an idealized model used for analysis,
When MP₁ becomes negative, TP start to decline.
Extuples Suppose that the short-run production function of certain cut-flower firm is given by: Q=4KL-0.6K2 - 0.112 •
Where is quantity of cut flower produced, I is labour input and K is fixed capital input (K-5). Determine the average product of lab
Kelo
Extuples Suppose that the short-run production function of certain cut-flower firm is given by: Q=4KL-0.6K2 - 0.112 •
Where is quantity of cut flower produced, I is labour input and K is fixed capital input (K-5). Determine the average product of labour (APL) and marginal product of labour (MPL)
Quantity demanded refers to the specific amount of a good or service that consumers are willing and able to purchase at a give price and within a specific time period. Demand, on the other hand, is a broader concept that encompasses the entire relationship between price and quantity demanded
Ezea
ok
Shukri
how do you save a country economic situation when it's falling apart
Economic growth as an increase in the production and consumption of goods and services within an economy.but
Economic development as a broader concept that encompasses not only economic growth but also social & human well being.
Shukri
production function means
Jabir
What do you think is more important to focus on when considering inequality ?
sir...I just want to ask one question... Define the term contract curve? if you are free please help me to find this answer 🙏
Asui
it is a curve that we get after connecting the pareto optimal combinations of two consumers after their mutually beneficial trade offs
Awais
thank you so much 👍 sir
Asui
In economics, the contract curve refers to the set of points in an Edgeworth box diagram where both parties involved in a trade cannot be made better off without making one of them worse off. It represents the Pareto efficient allocations of goods between two individuals or entities, where neither p
Cornelius
In economics, the contract curve refers to the set of points in an Edgeworth box diagram where both parties involved in a trade cannot be made better off without making one of them worse off. It represents the Pareto efficient allocations of goods between two individuals or entities,
Cornelius
Suppose a consumer consuming two commodities X and Y has
The following utility function u=X0.4 Y0.6. If the price of the X and Y are 2 and 3 respectively and income Constraint is birr 50.
A,Calculate quantities of x and y which maximize utility.
B,Calculate value of Lagrange multiplier.
C,Calculate quantities of X and Y consumed with a given price.
D,alculate optimum level of output .
the market for lemon has 10 potential consumers, each having an individual demand curve p=101-10Qi, where p is price in dollar's per cup and Qi is the number of cups demanded per week by the i th consumer.Find the market demand curve using algebra. Draw an individual demand curve and the market dema
suppose the production function is given by ( L, K)=L¼K¾.assuming capital is fixed find APL and MPL. consider the following short run production function:Q=6L²-0.4L³ a) find the value of L that maximizes output b)find the value of L that maximizes marginal product