<< Chapter < Page Chapter >> Page >
  • Describe three-dimensional space mathematically.
  • Locate points in space using coordinates.
  • Write the distance formula in three dimensions.
  • Write the equations for simple planes and spheres.
  • Perform vector operations in 3 .

Vectors are useful tools for solving two-dimensional problems. Life, however, happens in three dimensions. To expand the use of vectors to more realistic applications, it is necessary to create a framework for describing three-dimensional space. For example, although a two-dimensional map is a useful tool for navigating from one place to another, in some cases the topography of the land is important. Does your planned route go through the mountains? Do you have to cross a river? To appreciate fully the impact of these geographic features, you must use three dimensions. This section presents a natural extension of the two-dimensional Cartesian coordinate plane into three dimensions.

Three-dimensional coordinate systems

As we have learned, the two-dimensional rectangular coordinate system contains two perpendicular axes: the horizontal x -axis and the vertical y -axis. We can add a third dimension, the z -axis, which is perpendicular to both the x -axis and the y -axis. We call this system the three-dimensional rectangular coordinate system. It represents the three dimensions we encounter in real life.

Definition

The three-dimensional rectangular coordinate system    consists of three perpendicular axes: the x -axis, the y -axis, and the z -axis. Because each axis is a number line representing all real numbers in , the three-dimensional system is often denoted by 3 .

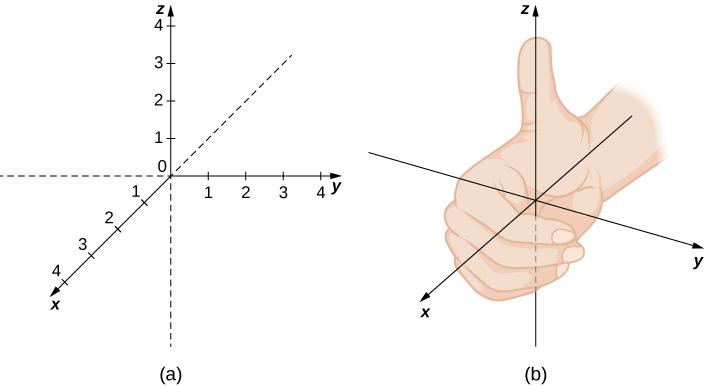
In [link] (a), the positive z -axis is shown above the plane containing the x - and y -axes. The positive x -axis appears to the left and the positive y -axis is to the right. A natural question to ask is: How was arrangement determined? The system displayed follows the right-hand rule    . If we take our right hand and align the fingers with the positive x -axis, then curl the fingers so they point in the direction of the positive y -axis, our thumb points in the direction of the positive z -axis. In this text, we always work with coordinate systems set up in accordance with the right-hand rule. Some systems do follow a left-hand rule, but the right-hand rule is considered the standard representation.

This figure has two images. The first is a 3-dimensional coordinate system. The x-axis is forward, the y-axis is horizontal to the left and right, and the z-axis is vertical. The second image is the 3-dimensional coordinate system axes with a right hand. The thumb is pointing towards positive z-axis, with the fingers wrapping around the z-axis from the positive x-axis to the positive y-axis.
(a) We can extend the two-dimensional rectangular coordinate system by adding a third axis, the z -axis, that is perpendicular to both the x -axis and the y -axis. (b) The right-hand rule is used to determine the placement of the coordinate axes in the standard Cartesian plane.

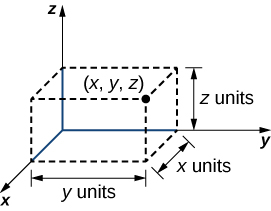
In two dimensions, we describe a point in the plane with the coordinates ( x , y ) . Each coordinate describes how the point aligns with the corresponding axis. In three dimensions, a new coordinate, z , is appended to indicate alignment with the z -axis: ( x , y , z ) . A point in space is identified by all three coordinates ( [link] ). To plot the point ( x , y , z ) , go x units along the x -axis, then y units in the direction of the y -axis, then z units in the direction of the z -axis.

This figure is the positive octant of the 3-dimensional coordinate system. In the first octant there is a rectangular solid drawn with broken lines. One corner is labeled (x, y, z). The height of the box is labeled “z units,” the width is labeled “x units” and the length is labeled “y units.”
To plot the point ( x , y , z ) go x units along the x -axis, then y units in the direction of the y -axis, then z units in the direction of the z -axis.

Questions & Answers

how do you get the 2/50
Abba Reply
number of sport play by 50 student construct discrete data
Aminu Reply
width of the frangebany leaves on how to write a introduction
Theresa Reply
Solve the mean of variance
Veronica Reply
Step 1: Find the mean. To find the mean, add up all the scores, then divide them by the number of scores. ... Step 2: Find each score's deviation from the mean. ... Step 3: Square each deviation from the mean. ... Step 4: Find the sum of squares. ... Step 5: Divide the sum of squares by n – 1 or N.
kenneth
what is error
Yakuba Reply
Is mistake done to something
Vutshila
Hy
anas
hy
What is the life teble
anas
hy
Jibrin
statistics is the analyzing of data
Tajudeen Reply
what is statics?
Zelalem Reply
how do you calculate mean
Gloria Reply
diveving the sum if all values
Shaynaynay
let A1,A2 and A3 events be independent,show that (A1)^c, (A2)^c and (A3)^c are independent?
Fisaye Reply
what is statistics
Akhisani Reply
data collected all over the world
Shaynaynay
construct a less than and more than table
Imad Reply
The sample of 16 students is taken. The average age in the sample was 22 years with astandard deviation of 6 years. Construct a 95% confidence interval for the age of the population.
Aschalew Reply
Bhartdarshan' is an internet-based travel agency wherein customer can see videos of the cities they plant to visit. The number of hits daily is a normally distributed random variable with a mean of 10,000 and a standard deviation of 2,400 a. what is the probability of getting more than 12,000 hits? b. what is the probability of getting fewer than 9,000 hits?
Akshay Reply
Bhartdarshan'is an internet-based travel agency wherein customer can see videos of the cities they plan to visit. The number of hits daily is a normally distributed random variable with a mean of 10,000 and a standard deviation of 2,400. a. What is the probability of getting more than 12,000 hits
Akshay
1
Bright
Sorry i want to learn more about this question
Bright
Someone help
Bright
a= 0.20233 b=0.3384
Sufiyan
a
Shaynaynay
How do I interpret level of significance?
Mohd Reply
It depends on your business problem or in Machine Learning you could use ROC- AUC cruve to decide the threshold value
Shivam
how skewness and kurtosis are used in statistics
Owen Reply
yes what is it
Taneeya
Got questions? Join the online conversation and get instant answers!
Jobilize.com Reply
Practice Key Terms 6

Get Jobilize Job Search Mobile App in your pocket Now!

Get it on Google Play Download on the App Store Now


Source:  OpenStax, Calculus volume 3. OpenStax CNX. Feb 05, 2016 Download for free at http://legacy.cnx.org/content/col11966/1.2
Google Play and the Google Play logo are trademarks of Google Inc.

Notification Switch

Would you like to follow the 'Calculus volume 3' conversation and receive update notifications?

Ask