<< Chapter < Page Chapter >> Page >
This module is from Elementary Algebra by Denny Burzynski and Wade Ellis, Jr. The symbols, notations, and properties of numbers that form the basis of algebra, as well as exponents and the rules of exponents, are introduced in this chapter. Each property of real numbers and the rules of exponents are expressed both symbolically and literally. Literal explanations are included because symbolic explanations alone may be difficult for a student to interpret.Objectives of this module: be familiar with the real number line and the real numbers, understand the ordering of the real numbers.

Overview

  • The Real Number Line
  • The Real Numbers
  • Ordering the Real Numbers

The real number line

Real number line

In our study of algebra, we will use several collections of numbers. The real number line allows us to visually display the numbers in which we are interested.

A line is composed of infinitely many points. To each point we can associate a unique number, and with each number we can associate a particular point.

Coordinate

The number associated with a point on the number line is called the coordinate of the point.

Graph

The point on a line that is associated with a particular number is called the graph of that number.

We construct the real number line as follows:

    Construction of the real number line

  1. Draw a horizontal line.

    A horizontal line with arrows on both the ends.
  2. Choose any point on the line and label it 0. This point is called the origin .

    A horizontal line with arrows on both the ends,  and a mark labeled as zero.
  3. Choose a convenient length. This length is called "1 unit." Starting at 0, mark this length off in both directions, being careful to have the lengths look like they are about the same.

    A horizontal line with arrows on both the ends, and a mark labeled as zero. There are  equidistant marks on both sides of zero.

    We now define a real number.

Real number

A real number is any number that is the coordinate of a point on the real number line.

Positive and negative real numbers

The collection of these infinitely many numbers is called the collection of real numbers . The real numbers whose graphs are to the right of 0 are called the positive real numbers . The real numbers whose graphs appear to the left of 0 are called the negative real numbers .
The real numbers having graphs on the right side of the origin are positive numbers, and those having graphs on the left side of the origin are negative numbers.

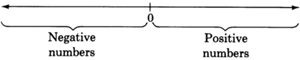
The number 0 is neither positive nor negative.

The real numbers

The collection of real numbers has many subcollections. The subcollections that are of most interest to us are listed below along with their notations and graphs.

Natural numbers

The natural numbers ( N ) :    { 1 , 2 , 3 , }

Graphs of natural numbers one to six plotted on a number line. The numberline has arrows on each sides, and is labeled from zero to six in increments of one. There are three dots after six indicating that the graph continues indefinitely.

Whole numbers

The whole numbers ( W ) :    { 0 , 1 , 2 , 3 , }

Graphs of whole numbers zero to six plotted on a number line. The number line has arrows on each side, and is labeled from zero to six in increments of one. There are three dots after six indicating that the graph continues indefinitely.

Notice that every natural number is a whole number.

Integers

The integers ( Z ) :    { , 3 , 2 , 1 , 0 , 1 , 2 , 3 , }

Graphs of integers negative five to five plotted on a number line. The number line has arrows on each side, and is labeled from negative five to five in increments of one. There are three dots after five indicating that the graph continues indefinitely.

Notice that every whole number is an integer.

Rational numbers

The rational numbers ( Q ) : Rational numbers are real numbers that can be written in the form a / b , where a and b are integers, and b 0 .

Fractions

Rational numbers are commonly called fractions.

Division by 1

Since b can equal 1, every integer is a rational number: a 1 = a .

Division by 0

Recall that 10 / 2 = 5 since 2 5 = 10 . However, if 10 / 0 = x , then 0 x = 10 . But 0 x = 0 , not 10. This suggests that no quotient exists.

Now consider 0 / 0 = x . If 0 / 0 = x , then 0 x = 0 . But this means that x could be any number, that is, 0 / 0 = 4 since 0 4 = 0 , or 0 / 0 = 28 since 0 28 = 0 . This suggests that the quotient is indeterminant.

Questions & Answers

differentiate between demand and supply giving examples
Lambiv Reply
differentiated between demand and supply using examples
Lambiv
what is labour ?
Lambiv
how will I do?
Venny Reply
how is the graph works?I don't fully understand
Rezat Reply
information
Eliyee
devaluation
Eliyee
t
WARKISA
hi guys good evening to all
Lambiv
multiple choice question
Aster Reply
appreciation
Eliyee
explain perfect market
Lindiwe Reply
In economics, a perfect market refers to a theoretical construct where all participants have perfect information, goods are homogenous, there are no barriers to entry or exit, and prices are determined solely by supply and demand. It's an idealized model used for analysis,
Ezea
What is ceteris paribus?
Shukri Reply
other things being equal
AI-Robot
When MP₁ becomes negative, TP start to decline. Extuples Suppose that the short-run production function of certain cut-flower firm is given by: Q=4KL-0.6K2 - 0.112 • Where is quantity of cut flower produced, I is labour input and K is fixed capital input (K-5). Determine the average product of lab
Kelo
Extuples Suppose that the short-run production function of certain cut-flower firm is given by: Q=4KL-0.6K2 - 0.112 • Where is quantity of cut flower produced, I is labour input and K is fixed capital input (K-5). Determine the average product of labour (APL) and marginal product of labour (MPL)
Kelo
yes,thank you
Shukri
Can I ask you other question?
Shukri
what is monopoly mean?
Habtamu Reply
What is different between quantity demand and demand?
Shukri Reply
Quantity demanded refers to the specific amount of a good or service that consumers are willing and able to purchase at a give price and within a specific time period. Demand, on the other hand, is a broader concept that encompasses the entire relationship between price and quantity demanded
Ezea
ok
Shukri
how do you save a country economic situation when it's falling apart
Lilia Reply
what is the difference between economic growth and development
Fiker Reply
Economic growth as an increase in the production and consumption of goods and services within an economy.but Economic development as a broader concept that encompasses not only economic growth but also social & human well being.
Shukri
production function means
Jabir
What do you think is more important to focus on when considering inequality ?
Abdisa Reply
any question about economics?
Awais Reply
sir...I just want to ask one question... Define the term contract curve? if you are free please help me to find this answer 🙏
Asui
it is a curve that we get after connecting the pareto optimal combinations of two consumers after their mutually beneficial trade offs
Awais
thank you so much 👍 sir
Asui
In economics, the contract curve refers to the set of points in an Edgeworth box diagram where both parties involved in a trade cannot be made better off without making one of them worse off. It represents the Pareto efficient allocations of goods between two individuals or entities, where neither p
Cornelius
In economics, the contract curve refers to the set of points in an Edgeworth box diagram where both parties involved in a trade cannot be made better off without making one of them worse off. It represents the Pareto efficient allocations of goods between two individuals or entities,
Cornelius
Suppose a consumer consuming two commodities X and Y has The following utility function u=X0.4 Y0.6. If the price of the X and Y are 2 and 3 respectively and income Constraint is birr 50. A,Calculate quantities of x and y which maximize utility. B,Calculate value of Lagrange multiplier. C,Calculate quantities of X and Y consumed with a given price. D,alculate optimum level of output .
Feyisa Reply
Answer
Feyisa
c
Jabir
the market for lemon has 10 potential consumers, each having an individual demand curve p=101-10Qi, where p is price in dollar's per cup and Qi is the number of cups demanded per week by the i th consumer.Find the market demand curve using algebra. Draw an individual demand curve and the market dema
Gsbwnw Reply
suppose the production function is given by ( L, K)=L¼K¾.assuming capital is fixed find APL and MPL. consider the following short run production function:Q=6L²-0.4L³ a) find the value of L that maximizes output b)find the value of L that maximizes marginal product
Abdureman
types of unemployment
Yomi Reply
What is the difference between perfect competition and monopolistic competition?
Mohammed
Got questions? Join the online conversation and get instant answers!
Jobilize.com Reply

Get Jobilize Job Search Mobile App in your pocket Now!

Get it on Google Play Download on the App Store Now


Source:  OpenStax, Elementary algebra. OpenStax CNX. May 08, 2009 Download for free at http://cnx.org/content/col10614/1.3
Google Play and the Google Play logo are trademarks of Google Inc.

Notification Switch

Would you like to follow the 'Elementary algebra' conversation and receive update notifications?

Ask