

| << Chapter < Page | Chapter >> Page > |
One simple graph, the stem-and-leaf graph or stem plot , comes from the field of exploratory data analysis.It is a good choice when the data sets are small. To create the plot, divide each observation of data into a stem and a leaf. The leaf consists of a final significant digit . For example, 23 has stem 2 and leaf 3. Four hundred thirty-two (432) has stem 43 and leaf 2. Five thousand four hundred thirty-two (5,432) has stem 543 and leaf 2. The decimal 9.3 has stem 9 and leaf 3. Write the stems in a vertical line from smallest the largest. Draw a vertical line to the right of the stems. Then write the leaves in increasing order next to their corresponding stem.
For Susan Dean's spring pre-calculus class, scores for the first exam were as follows (smallest to largest):
| Stem | Leaf |
|---|---|
| 3 | 3 |
| 4 | 299 |
| 5 | 355 |
| 6 | 1378899 |
| 7 | 2348 |
| 8 | 03888 |
| 9 | 0244446 |
| 10 | 0 |
The stem plot shows that most scores fell in the 60s, 70s, 80s, and 90s. Eight out of the 31 scores or approximately 26% of the scores were in the 90's or 100, a fairly high number of As.
The stem plot is a quick way to graph and gives an exact picture of the data. You want to look for an overall pattern and any outliers. An outlier is an observation of data that does not fit the rest of the data. It is sometimes called an extreme value. When you graph an outlier, it will appear not to fit the pattern of the graph. Some outliers are due to mistakes (for example, writing down 50 instead of 500) while others may indicate that something unusual is happening. It takes some background information to explain outliers. In the example above, there were no outliers.
Create a stem plot using the data:
The data are the distance (in kilometers) from a home to the nearest supermarket.
The value 12.3 may be an outlier. Values appear to concentrate at 3 and 4 kilometers.
| Stem | Leaf |
|---|---|
| 1 | 1 5 |
| 2 | 3 5 7 |
| 3 | 2 3 3 5 8 |
| 4 | 0 2 5 5 7 8 |
| 5 | 5 6 |
| 6 | 5 7 |
| 7 | |
| 8 | |
| 9 | |
| 10 | |
| 11 | |
| 12 | 3 |
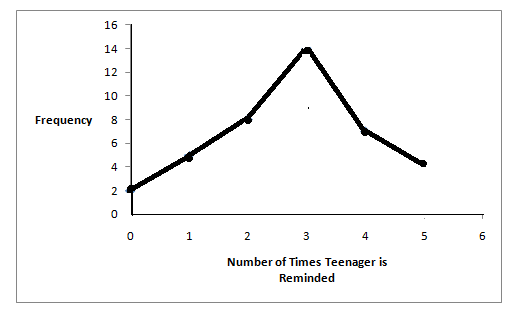
Another type of graph that is useful for specific data values is a line graph . In the particular line graph shown in the example, the x-axis consists of data values and the y-axis consists of frequency points . The frequency points are connected.
In a survey, 40 mothers were asked how many times per week a teenager must be reminded to do his/her chores. The results are shown in the table and the line graph.
| Number of times teenager is reminded | Frequency |
|---|---|
| 0 | 2 |
| 1 | 5 |
| 2 | 8 |
| 3 | 14 |
| 4 | 7 |
| 5 | 4 |
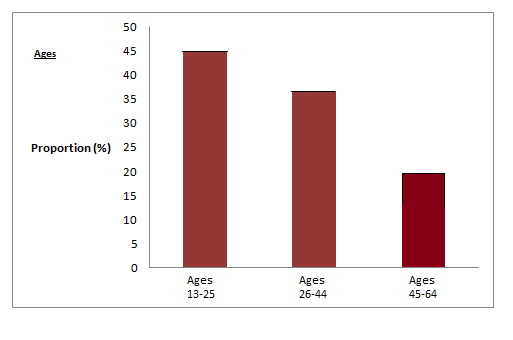
Bar graphs consist of bars that are separated from each other. The bars can be rectangles or they can be rectangular boxes and they can be vertical or horizontal.
The bar graph shown in Example 4 has age groups represented on the x-axis and proportions on the y-axis .
By the end of 2011, in the United States, Facebook had over 146 million users. The table shows three age groups, the number of users in each age group and the proportion (%) of users in each age group. Source: http://www.kenburbary.com/2011/03/facebook-demographics-revisited-2011-statistics-2/
| Age groups | Number of Facebook users | Proportion (%) of Facebook users |
|---|---|---|
| 13 - 25 | 65,082,280 | 45% |
| 26 - 44 | 53,300,200 | 36% |
| 45 - 64 | 27,885,100 | 19% |
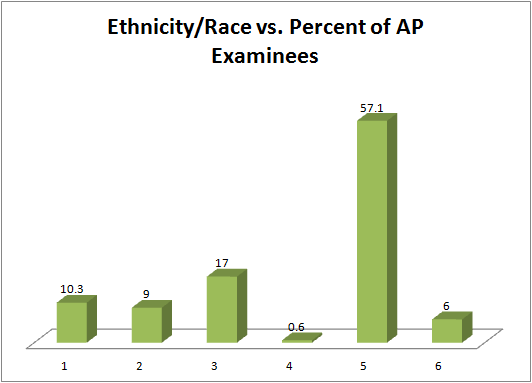
The columns in the table below contain the race/ethnicity of U.S. Public Schools: High School Class of 2011, percentages for the Advanced Placement Examinee Population for that class and percentages for the Overall Student Population. The 3-dimensional graph shows the Race/Ethnicity of U.S. Public Schools (qualitative data) on the x-axis and Advanced Placement Examinee Population percentages on the y-axis . ( Source: http://www.collegeboard.com and Source: http://apreport.collegeboard.org/goals-and-findings/promoting-equity )
| Race/Ethnicity | AP Examinee Population | Overall Student Population |
|---|---|---|
| 1 = Asian, Asian American or Pacific Islander | 10.3% | 5.7% |
| 2 = Black or African American | 9.0% | 14.7% |
| 3 = Hispanic or Latino | 17.0% | 17.6% |
| 4 = American Indian or Alaska Native | 0.6% | 1.1% |
| 5 = White | 57.1% | 59.2% |
| 6 = Not reported/other | 6.0% | 1.7% |
Go to Outcomes of Education Figure 22 for an example of a bar graph that shows unemployment rates of persons 25 years and older for 2009.
Notification Switch
Would you like to follow the 'Collaborative statistics (with edits: teegarden)' conversation and receive update notifications?

|
|

|
|

|
|

|
|

|
|

|
|

|
|

|
|

|
|

|