The domain of
was given to be all
such that
for any integer
Would the domain of
Yes. The excluded points of the domain follow the vertical asymptotes. Their locations show the horizontal shift and compression or expansion implied by the transformation to the original function’s input.
Given a function of the form
graph one period.
Express the function given in the form
Identify
and determine the period,
Draw the graph of
Use the reciprocal relationship between
and
to draw the graph of
Sketch the asymptotes.
Plot any two reference points and draw the graph through these points.
Graphing a variation of the cosecant function
Graph one period of
Step 1. The given function is already written in the general form,
Step 2.
so the stretching factor is 3.
Step 3.
so
The period is
units.
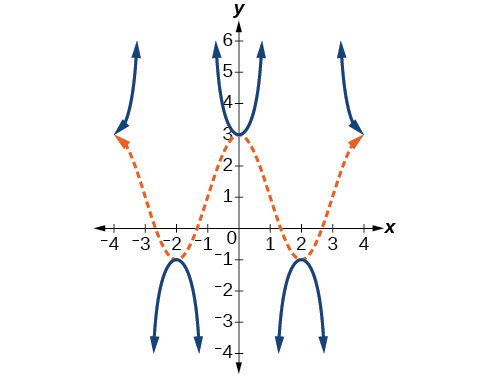
Step 4. Sketch the graph of the function
Step 5. Use the reciprocal relationship of the sine and cosecant functions to draw the
cosecant function .
Steps 6–7. Sketch three asymptotes at
and
We can use two reference points, the local maximum at
and the local minimum at
[link] shows the graph.
Graph one period of
Given a function of the form
graph one period.
Express the function given in the form
Identify the stretching/compressing factor,
Identify
and determine the period,
Identify
and determine the phase shift,
Draw the graph of
but shift it to the right by and up by
Sketch the vertical asymptotes, which occur at
where
is an integer.
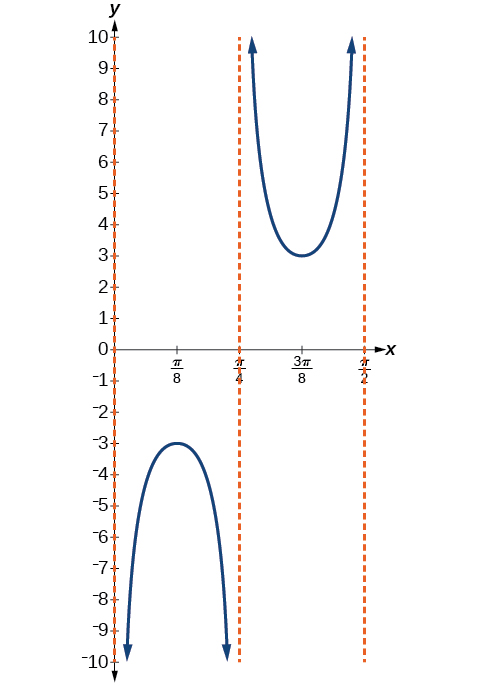
Graphing a vertically stretched, horizontally compressed, and vertically shifted cosecant
Sketch a graph of
What are the domain and range of this function?
Step 1. Express the function given in the form
Step 2. Identify the stretching/compressing factor,
Step 3. The period is
Step 4. The phase shift is
Step 5. Draw the graph of
but shift it up
Step 6. Sketch the vertical asymptotes, which occur at
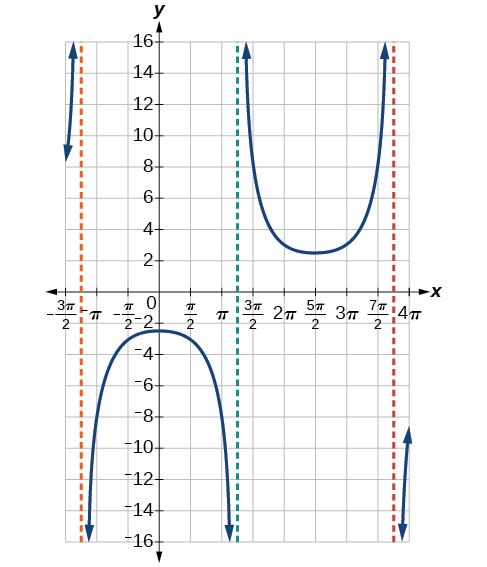
Given the graph of
shown in
[link] , sketch the graph of
on the same axes.
Analyzing the graph of
y = cot
x
The last trigonometric function we need to explore is
cotangent . The cotangent is defined by the
reciprocal identity
Notice that the function is undefined when the tangent function is 0, leading to a vertical asymptote in the graph at
etc. Since the output of the tangent function is all real numbers, the output of the
cotangent function is also all real numbers.
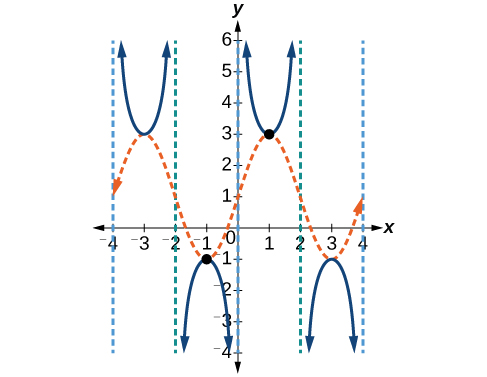
We can graph
by observing the graph of the tangent function because these two functions are reciprocals of one another. See
[link] . Where the graph of the tangent function decreases, the graph of the cotangent function increases. Where the graph of the tangent function increases, the graph of the cotangent function decreases.
the study of living organisms and their interactions with one another and their environment.
Wine
discuss the biological phenomenon and provide pieces of evidence to show that it was responsible for the formation of eukaryotic organelles in an essay form
advantage of electronic microscope is easily and clearly while disadvantage is dangerous because its electronic. advantage of light microscope is savely and naturally by sun while disadvantage is not easily,means its not sharp and not clear
Abdullahi
cell theory state that every organisms composed of one or more cell,cell is the basic unit of life
Abdullahi
is like gone fail us
DENG
cells is the basic structure and functions of all living things
A scanning electron microscope (SEM) is ideal for situations requiring high-resolution imaging of surfaces. It is commonly used in materials science, biology, and geology to examine the topography and composition of samples at a nanoscale level. SEM is particularly useful for studying fine details,


![A graph of two periods of a modified cosine function. Range is [-1,3], graphed from x=-4 to x=4.](/ocw/mirror/col11845_1.2_complete/m49389/CNX_Precalc_Figure_06_02_015.jpg)