

| << Chapter < Page | Chapter >> Page > |
The following data are the number of books bought by 50 part-time college students at ABC College. The number of books is
discrete data , since books are counted.
1; 1; 1; 1; 1; 1; 1; 1; 1; 1; 1
2; 2; 2; 2; 2; 2; 2; 2; 2; 2
3; 3; 3; 3; 3; 3; 3; 3; 3; 3; 3; 3; 3; 3; 3; 3
4; 4; 4; 4; 4; 4
5; 5; 5; 5; 5
6; 6
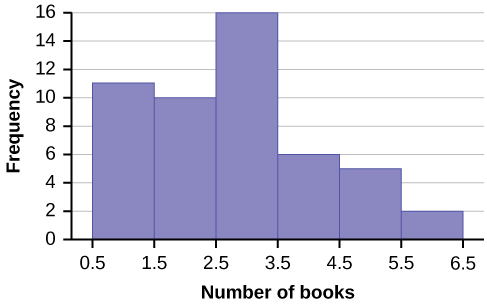
Eleven students buy one book. Ten students buy two books. Sixteen students buy three books. Six students buy four books. Five students buy five books. Two students buy six books.
Because the data are integers, subtract 0.5 from 1, the smallest data value and add 0.5 to 6, the largest data value. Then the starting point is 0.5 and the ending value is 6.5.
Next, calculate the width of each bar or class interval. If the data are discrete and there are not too many different values, a width that places the data values in the middle of the bar or class interval is the most convenient. Since the data consist of the numbers 1, 2, 3, 4, 5, 6, and the starting point is 0.5, a width of one places the 1 in the middle of the interval from 0.5 to 1.5, the 2 in the middle of the interval from 1.5 to 2.5, the 3 in the middle of the interval from 2.5 to 3.5, the 4 in the middle of the interval from _______ to _______, the 5 in the middle of the interval from _______ to _______, and the _______ in the middle of the interval from _______ to _______ .
Calculate the number of bars as follows:
where 1 is the width of a bar. Therefore, bars = 6.
The following histogram displays the number of books on the x -axis and the frequency on the y -axis.
Using this data set, construct a histogram.
| Number of Hours My Classmates Spent Playing Video Games on Weekends | ||||
|---|---|---|---|---|
| 9.95 | 10 | 2.25 | 16.75 | 0 |
| 19.5 | 22.5 | 7.5 | 15 | 12.75 |
| 5.5 | 11 | 10 | 20.75 | 17.5 |
| 23 | 21.9 | 24 | 23.75 | 18 |
| 20 | 15 | 22.9 | 18.8 | 20.5 |
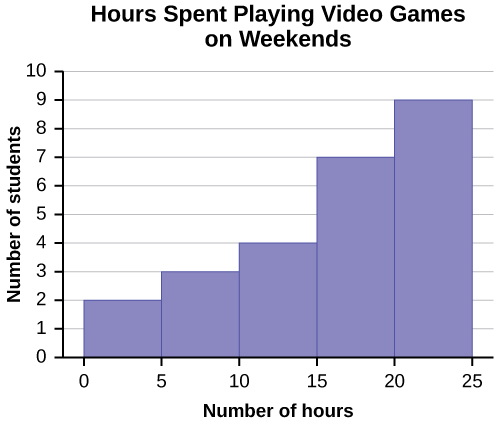
Some values in this data set fall on boundaries for the class intervals. A value is counted in a class interval if it falls on the left boundary, but not if it falls on the right boundary. Different researchers may set up histograms for the same data in different ways. There is more than one correct way to set up a histogram.
Frequency polygons are analogous to line graphs, and just as line graphs make continuous data visually easy to interpret, so too do frequency polygons.
To construct a frequency polygon, first examine the data and decide on the number of intervals, or class intervals, to use on the x -axis and y -axis. After choosing the appropriate ranges, begin plotting the data points. After all the points are plotted, draw line segments to connect them.
A frequency polygon was constructed from the frequency table below.
| Frequency Distribution for Calculus Final Test Scores | |||
|---|---|---|---|
| Lower Bound | Upper Bound | Frequency | Cumulative Frequency |
| 49.5 | 59.5 | 5 | 5 |
| 59.5 | 69.5 | 10 | 15 |
| 69.5 | 79.5 | 30 | 45 |
| 79.5 | 89.5 | 40 | 85 |
| 89.5 | 99.5 | 15 | 100 |
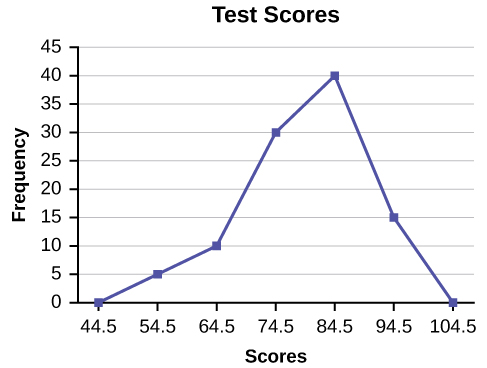
The first label on the x -axis is 44.5. This represents an interval extending from 39.5 to 49.5. Since the lowest test score is 54.5, this interval is used only to allow the graph to touch the x -axis. The point labeled 54.5 represents the next interval, or the first “real” interval from the table, and contains five scores. This reasoning is followed for each of the remaining intervals with the point 104.5 representing the interval from 99.5 to 109.5. Again, this interval contains no data and is only used so that the graph will touch the x -axis. Looking at the graph, we say that this distribution is skewed because one side of the graph does not mirror the other side.
Notification Switch
Would you like to follow the 'Introductory statistics' conversation and receive update notifications?

|
|

|
|

|
|

|
|

|
|

|
|

|
|

|
|

|
|

|