<< Chapter < Page Chapter >> Page >

Numerical identification of outliers: calculating s And finding outliers manually

If you do not have the function LinRegTTest, then you can calculate the outlier in the first example by doing the following.

First, square each | y - y ^ | (See the TABLE above):

The squares are

  • 35 2
  • 17 2
  • 16 2
  • 6 2
  • 19 2
  • 9 2
  • 3 2
  • 1 2
  • 10 2
  • 9 2
  • 1 2

Then, add (sum) all the | y - y ^ | squared terms using the formula

Σ i = 1 11 ( | y i - y ^ i | ) 2 = Σ i = 1 11 ε i 2 (Recall that y i - y ^ i = ε i .)

= 35 2 + 17 2 + 16 2 + 6 2 + 19 2 + 9 2 + 3 2 + 1 2 + 10 2 + 9 2 + 1 2

= 2440 = SSE . The result, SSE is the Sum of Squared Errors.

Next, calculate s , the standard deviation of all the y - y ^ = ε values where n = the total number of data points.

The calculation is s = SSE n - 2

For the third exam/final exam problem, s = 2440 11 - 2 = 16.47

Next, multiply s by 1.9 :
( 1.9 ) ( 16.47 ) = 31.29
31.29 is almost 2 standard deviations away from the mean of the y - y ^ values.

If we were to measure the vertical distance from any data point to the corresponding point on the line of best fit and that distance is at least 1.9 s , then we would consider the data point to be "too far" from the line of best fit. We call that point a potential outlier .

For the example, if any of the | y - y ^ | values are at least 31.29, the corresponding ( x , y ) data point is a potential outlier.

For the third exam/final exam problem, all the | y - y ^ | 's are less than 31.29 except for the first one which is 35.

35 > 31.29 That is, | y - y ^ | ( 1.9 ) ( s )

The point which corresponds to | y - y ^ | = 35 is ( 65 , 175 ) . Therefore, the data point ( 65 , 175 ) is a potential outlier. For this example, we will delete it. (Remember, we do not always delete an outlier.)

The next step is to compute a new best-fit line using the 10 remaining points. The new line of best fit and the correlation coefficient are:

y ^ = -355.19 + 7.39 x and r = 0.9121

Using this new line of best fit (based on the remaining 10 data points), what would a student who receives a 73 on the third exam expect to receive on the final exam? Is this the same as the prediction made using the original line?

Using the new line of best fit, y ^ = -355.19 + 7.39(73) = 184.28 . A student who scored 73 points on the third exam would expect to earn 184 points on the final exam.

The original line predicted y ^ = -173.51 + 4.83(73) = 179.08 so the prediction using the new line with the outlier eliminated differs from the original prediction.

( From The Consumer Price Indexes Web site ) The Consumer Price Index (CPI) measures the average change over time in the prices paid by urban consumers for consumer goods and services. The CPI affects nearly all Americans because of the many waysit is used. One of its biggest uses is as a measure of inflation. By providing information about price changes in the Nation's economy to government, business, and labor, the CPI helps themto make economic decisions. The President, Congress, and the Federal Reserve Board use the CPI's trends to formulate monetary and fiscal policies. In the following table, x is the year and y is the CPI.

Data:
x y
1915   10.1  
1926 17.7
1935 13.7
1940 14.7
1947 24.1
1952 26.5
1964 31.0
1969 36.7
1975 49.3
1979 72.6
1980 82.4
1986 109.6
1991 130.7
1999 166.6
  • Make a scatterplot of the data.
  • Calculate the least squares line. Write the equation in the form y ^ = a + b x .
  • Draw the line on the scatterplot.
  • Find the correlation coefficient. Is it significant?
  • What is the average CPI for the year 1990?
  • Scatter plot and line of best fit.
  • y ^ = -3204 + 1.662 x is the equation of the line of best fit.
  • r = 0.8694
  • The number of data points is n = 14 . Use the 95% Critical Values of the Sample Correlation Coefficient table at the end of Chapter 12. n - 2 = 12 . The corresponding critical value is 0.532. Since 0.8694 > 0.532 , r is significant.
  • y ^ = -3204 + 1.662 ( 1990 ) = 103.4 CPI
  • Using the calculator LinRegTTest, we find that s = 25.4 ; graphing the lines Y2=-3204+1.662X-2(25.4) and Y3=-3204+1.662X+2(25.4) shows that no data values are outside those lines, identifying no outliers. (Note that the year 1999 was very close to the upper line, but still inside it.)
Scatter plot and line of best fit of the consumer price index data, on the y-axis, and year data, on the x-axis.
In the example, notice the pattern of the points compared to the line. Although the correlation coefficient is significant, the pattern in the scatterplot indicates that a curve would be a more appropriate model to use than a line. In this example, a statistician should prefer to use other methods to fit a curve to this data, rather than model the data with the line we found. In addition to doing the calculations, it is always important to look at the scatterplot when deciding whether a linear model is appropriate.

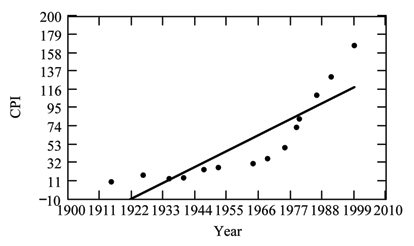
If you are interested in seeing more years of data, visit the Bureau of Labor Statistics CPI website ftp://ftp.bls.gov/pub/special.requests/cpi/cpiai.txt ; our data is taken from the column entitled "Annual Avg." (third column from the right). For example you could add more current years of data. Try adding the more recent years 2004 : CPI=188.9, 2008 : CPI=215.3 and 2011: CPI=224.9. See how it affects the model. (Check: y ^ = -4436 + 2.295 x . r = 0.9018 . Is r significant? Is the fit better with the addition of the new points?)

**With contributions from Roberta Bloom

Questions & Answers

what is phylogeny
Odigie Reply
evolutionary history and relationship of an organism or group of organisms
AI-Robot
ok
Deng
what is biology
Hajah Reply
the study of living organisms and their interactions with one another and their environments
AI-Robot
what is biology
Victoria Reply
HOW CAN MAN ORGAN FUNCTION
Alfred Reply
the diagram of the digestive system
Assiatu Reply
allimentary cannel
Ogenrwot
How does twins formed
William Reply
They formed in two ways first when one sperm and one egg are splited by mitosis or two sperm and two eggs join together
Oluwatobi
what is genetics
Josephine Reply
Genetics is the study of heredity
Misack
how does twins formed?
Misack
What is manual
Hassan Reply
discuss biological phenomenon and provide pieces of evidence to show that it was responsible for the formation of eukaryotic organelles
Joseph Reply
what is biology
Yousuf Reply
the study of living organisms and their interactions with one another and their environment.
Wine
discuss the biological phenomenon and provide pieces of evidence to show that it was responsible for the formation of eukaryotic organelles in an essay form
Joseph Reply
what is the blood cells
Shaker Reply
list any five characteristics of the blood cells
Shaker
lack electricity and its more savely than electronic microscope because its naturally by using of light
Abdullahi Reply
advantage of electronic microscope is easily and clearly while disadvantage is dangerous because its electronic. advantage of light microscope is savely and naturally by sun while disadvantage is not easily,means its not sharp and not clear
Abdullahi
cell theory state that every organisms composed of one or more cell,cell is the basic unit of life
Abdullahi
is like gone fail us
DENG
cells is the basic structure and functions of all living things
Ramadan
What is classification
ISCONT Reply
is organisms that are similar into groups called tara
Yamosa
in what situation (s) would be the use of a scanning electron microscope be ideal and why?
Kenna Reply
A scanning electron microscope (SEM) is ideal for situations requiring high-resolution imaging of surfaces. It is commonly used in materials science, biology, and geology to examine the topography and composition of samples at a nanoscale level. SEM is particularly useful for studying fine details,
Hilary
Got questions? Join the online conversation and get instant answers!
Jobilize.com Reply
Practice Key Terms 1

Get Jobilize Job Search Mobile App in your pocket Now!

Get it on Google Play Download on the App Store Now


Source:  OpenStax, Quantitative information analysis iii. OpenStax CNX. Dec 25, 2009 Download for free at http://cnx.org/content/col11155/1.1
Google Play and the Google Play logo are trademarks of Google Inc.

Notification Switch

Would you like to follow the 'Quantitative information analysis iii' conversation and receive update notifications?

Ask