<< Chapter < Page Chapter >> Page >

By the end of this section, you will be able to:

  • Apply the production possibility frontier to evaluate the tradeoff between economic output and the environment
  • Interpret a graphic representation of the tradeoff between economic output and environmental protection

The tradeoff between economic output and the environment can be analyzed with a production possibility frontier (PPF) such as the one shown in [link] . At one extreme, at a choice like P, a country would be selecting a high level of economic output but very little environmental protection. At the other extreme, at a choice like T, a country would be selecting a high level of environmental protection but little economic output. According to the graph, an increase in environmental protection involves an opportunity cost of less economic output. No matter what their preferences, all societies should wish to avoid choices like M, which are productively inefficient. Efficiency requires that the choice should be on the production possibility frontier.

The tradeoff between economic output and environmental protection

The graph shows a trade-off example in which a society must prioritize either economic output or environmental protection.
Each society will have to weigh its own values and decide whether it prefers a choice like P with more economic output and less environmental protection, or a choice like T with more environmental protection and less economic output.

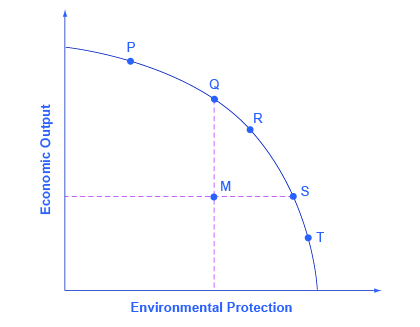
Economists do not have a great deal to say about the choice between P, Q, R, S and T in [link] , all of which lie along the production possibility frontier. Countries with low per capita gross domestic product (GDP)    , such as China, place a greater emphasis on economic output—which in turn helps to produce nutrition, shelter, health, education, and desirable consumer goods. Countries with higher income levels, where a greater share of people have access to the basic necessities of life, may be willing to place a relatively greater emphasis on environmental protection.

However, economists are united in their belief that an inefficient choice such as M is undesirable. Rather than choosing M, a nation could achieve either greater economic output with the same environmental protection, as at point Q, or greater environmental protection with the same level of output, as at point S. The problem with command-and-control environmental laws is that they sometimes involve a choice like M. Market-oriented environmental tools offer a mechanism either for providing either the same environmental protection at lower cost, or providing a greater degree of environmental protection for the same cost.

Keystone xl

So how would an economist respond to claims of environmental damage caused by the Keystone XL project? Clearly the environmental cost of oil spills would be considered a negative externality, but how many external costs would arise? And are these costs “too high” when measured against any potential for economic benefit?

As this chapter indicates, in deciding whether construction of the pipeline is a good idea, an economist would want to know not only about the marginal benefits resulting from the additional pipeline construction, but also the potential marginal costs—and especially the marginal external costs of the pipeline. Typically these come in the form of environmental impact statements, which are usually required for these kinds of projects. The most recent impact statement, released in March 2013 by the Nebraska Department of State, considered the possibility of fewer miles of pipeline going over the aquifer system and avoiding completely environmentally fragile areas; it indicated that “most resources” would not be harmed by construction of the pipeline.

As of press time, the Obama Administration has not approved construction of the Keystone XL project. While the economic benefits of additional oil in the United States may be fairly easily quantified, the social costs are not. It seems that, in a period of economic expansion, people want to err on the side of caution and estimate the marginal costs to be greater than the marginal benefits of additional oil generation. Those estimates may change, however, if the price of gasoline continues to rise.

Key concepts and summary

Depending on their different income levels and political preferences, countries are likely to make different choices about allocative efficiency    —that is, the choice between economic output and environmental protection along the production possibility frontier. However, all countries should prefer to make a choice that shows productive efficiency    —that is, the choice is somewhere on the production possibility frontier rather than inside it. Revisit Choice in a World of Scarcity for more on these terms.

Problems

In the Land of Purity, there is only one form of pollution, called “gunk.” [link] shows possible combinations of economic output and reduction of gunk, depending on what kinds of environmental regulations are chosen.

Combos Eco Output Gunk Cleaned Up
J 800 10%
K 500 30%
L 600 40%
M 400 40%
N 100 90%
  1. Sketch a graph of a production possibility frontier with environmental quality on the horizontal axis, measured by the percentage reduction of gunk, and with the quantity of economic output on the vertical axis.
  2. Which choices display productive efficiency? How can you tell?
  3. Which choices show allocative efficiency? How can you tell?
  4. In the choice between K and L, can you say which one is better and why?
  5. In the choice between K and N, can you say which one is better, and why?
  6. If you had to guess, which choice would you think is more likely to represent a command-and-control environmental policy and which choice is more likely to represent a market-oriented environmental policy, choice L or M? Why?
Got questions? Get instant answers now!

Questions & Answers

it is the relatively stable flow of income
Chidubem Reply
what is circular flow of income
Divine Reply
branches of macroeconomics
SHEDRACK Reply
what is Flexible exchang rate?
poudel Reply
is gdp a reliable measurement of wealth
Atega Reply
introduction to econometrics
Husseini Reply
Hi
mostafa
hi
LEMLEM
hello
Sammol
hi
Mahesh
bi
Ruqayat
hi
Ruqayat
Hi fellas
Nyawa
hey
Sammol
hi
God
hello
Jahara
Good morning
Jorge
hi
abubakar
hi
Nmesoma
hi
Mahesh
Hi
Tom
Why is unemployment rate never zero at full employment?
Priyanka Reply
bcoz of existence of frictional unemployment in our economy.
Umashankar
what is flexible exchang rate?
poudel
due to existence of the pple with disabilities
Abdulraufu
the demand of a good rises, causing the demand for another good to fall
Rushawn Reply
is it possible to leave every good at the same level
Joseph
I don't think so. because check it, if the demand for chicken increases, people will no longer consume fish like they used to causing a fall in the demand for fish
Anuolu
is not really possible to let the value of a goods to be same at the same time.....
Salome
Suppose the inflation rate is 6%, does it mean that all the goods you purchase will cost 6% more than previous year? Provide with reasoning.
Geetha Reply
Not necessarily. To measure the inflation rate economists normally use an averaged price index of a basket of certain goods. So if you purchase goods included in the basket, you will notice that you pay 6% more, otherwise not necessarily.
Waeth
discus major problems of macroeconomics
Alii Reply
what is the problem of macroeconomics
Yoal
Economic growth Stable prices and low unemployment
Ephraim
explain inflationcause and itis degre
Miresa Reply
what is inflation
Getu
increase in general price levels
WEETO
Good day How do I calculate this question: C= 100+5yd G= 2000 T= 2000 I(planned)=200. Suppose the actual output is 3000. What is the level of planned expenditures at this level of output?
Chisomo Reply
how to calculate actual output?
Chisomo
how to calculate the equilibrium income
Beshir
Criteria for determining money supply
Thapase Reply
who we can define macroeconomics in one line
Muhammad
Aggregate demand
Mohammed
C=k100 +9y and i=k50.calculate the equilibrium level of output
Mercy Reply
Hi
Isiaka
Hi
Geli
hy
Man
👋
Bahunda
hy how are you?
Man
ys
Amisha
how are you guys
Sekou
f9 guys
Amisha
how are you guys
Sekou
ys am also fine
Amisha
fine and you guys
Geli
from Nepal
Amisha
nawalparasi district from belatari
Amisha
nd u
Amisha
I am Camara from Guinea west Africa... happy to meet you guys here
Sekou
ma management ho
Amisha
ahile becheclor ho
Amisha
hjr ktm bta ho ani k kaam grnu hunxa tw
Amisha
belatari
Amisha
1st year ho
Amisha
nd u
Amisha
ahh
Amisha
kaha biratnagar
Amisha
ys
Amisha
kina k vo
Amisha
money as unit of account means what?
Kalombe
A unit of account is something that can be used to value goods and services and make calculations
Jim
all of you please speak in English I can't understand you're language
Muhammad
I want to know how can we define macroeconomics in one line
Muhammad
it must be .9 or 0.9 no Mpc is greater than 1 Y=100+.9Y+50 Y-.9Y=150 0.1Y/0.1=150/0.1 Y=1500
Kalombe
Mercy is it clear?😋
Kalombe
hi can someone help me on this question If a negative shocks shifts the IS curve to the left, what type of policy do you suggest so as to stabilize the level of output? discuss your answer using appropriate graph.
Galge Reply
if interest rate is increased this will will reduce the level of income shifting the curve to the left ◀️
Kalombe
Got questions? Join the online conversation and get instant answers!
Jobilize.com Reply

Get Jobilize Job Search Mobile App in your pocket Now!

Get it on Google Play Download on the App Store Now


Source:  OpenStax, Principles of economics. OpenStax CNX. Sep 19, 2014 Download for free at http://legacy.cnx.org/content/col11613/1.11
Google Play and the Google Play logo are trademarks of Google Inc.

Notification Switch

Would you like to follow the 'Principles of economics' conversation and receive update notifications?

Ask