

| << Chapter < Page | Chapter >> Page > |
In order to understand test results from standardized tests it is important to be familiar with a variety of terms and concepts that are fundamental to “measurement theory”, the academic study of measurement and assessment. Two major areas in measurement theory, reliability and validity, were discussed in the previous chapter; in this chapter we focus on concepts and terms associated with test scores.
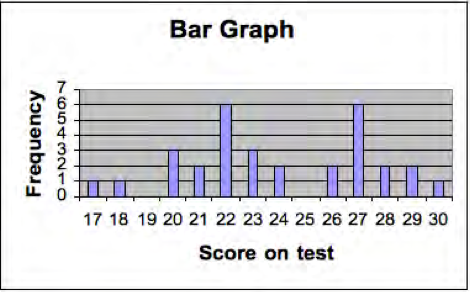
A frequency distribution is a listing of the number of students who obtained each score on a test. If 31 students take a test, and the scores range from 11 to 30 then the frequency distribution might look like [link] . We also show the same set of scores on a histogram or bar graph in [link] . The horizontal (or x axis) represents the score on the test and the vertical axis (y axis) represents the number or frequency of students. Plotting a frequency distribution helps us see what scores are typical and how much variability there are in the scores. We describe more precise ways of determining typical scores and variability next.
| Score on test | Frequency | Central tendency measures |
| 17 | 1 | |
| 18 | 1 | |
| 19 | 0 | |
| 20 | 3 | |
| 21 | 2 | |
| 22 | 6 | Mode |
| 23 | 3 | Median |
| 24 | 2 | Mean |
| 25 | 0 | |
| 26 | 2 | |
| 27 | 6 | Mode |
| 28 | 2 | |
| 29 | 2 | |
| 30 | 1 | |
| TOTAL | 31 |
There are three common ways of measuring central tendency or which score(s) are typical. The mean is calculated by adding up all the scores and dividing by the number of scores. In the example in [link] , the mean is 24. The median is the “middle” score of the distribution—that is half of the scores are above the median and half are below. The median on the distribution is 23 because 15 scores are above 23 and 15 are below. The mode is the score that occurs most often. In [link] there are actually two modes 22 and 27 and so this distribution is described as bimodal. Calculating the mean, median and mode are important as each provides different information for teachers. The median represents the score of the “middle” students, with half scoring above and below, but does not tell us about the scores on the test that occurred most often. The mean is important for some statistical calculations but is highly influenced by a few extreme scores (called outliers) but the median is not. To illustrate this, imagine a test out of 20 points taken by 10 students, and most do very well but one student does very poorly. The scores might be 4, 18, 18, 19, 19, 19, 19, 19, 20, 20. The mean is 17.5 (170/10) but if the lowest score (4) is eliminated the mean is now is 1.5 points higher at 19 (171/9). However, in this example the median remains at 19 whether the lowest score is included. When there are some extreme scores the median is often more useful for teachers in indicating the central tendency of the frequency distribution.
The measures of central tendency help us summarize scores that are representative, but they do not tell us anything about how variable or how spread out are the scores. [link] illustrates sets of scores from two different schools on the same test for fourth graders. Note that the mean for each is 40 but in School A the scores are much less spread out. A simple way to summarize variability is the range, which is the lowest score subtracted from the lowest score. In School A with low variability the range is (45—35) = 10; in the school B the range is ( 55-22 = 33).
Notification Switch
Would you like to follow the 'Educational psychology' conversation and receive update notifications?

|
|

|
|

|
|

|
|

|
|

|
|

|
|

|
|
|
|
|

|