

| << Chapter < Page | Chapter >> Page > |
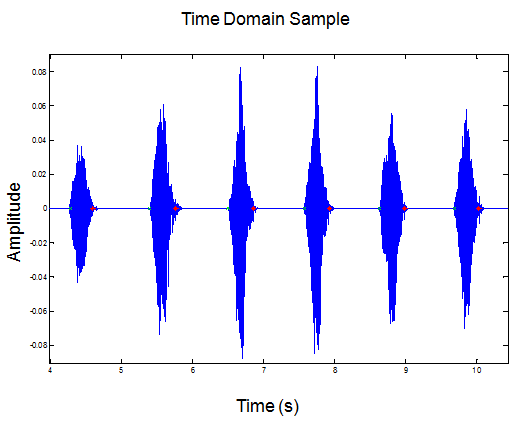
1. This time-domain signal shows clear segmentation between different numbers.
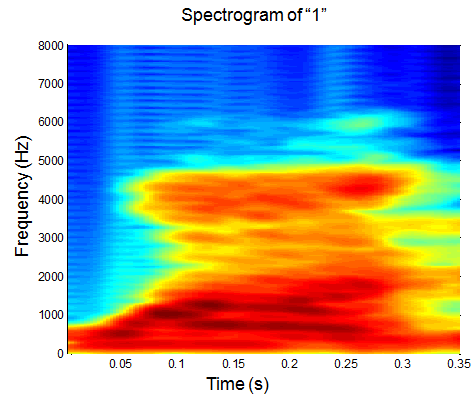
2.This shows a normalized spectrogram of the number “1”. Formants are visible but not clear.
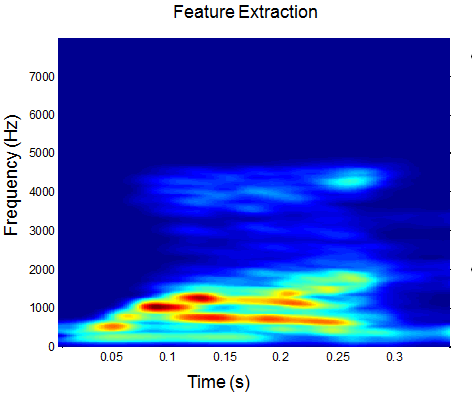
3. Enhanced by a non-linear filter to emphasize the difference between peak values and background. Formants are much more distinct.
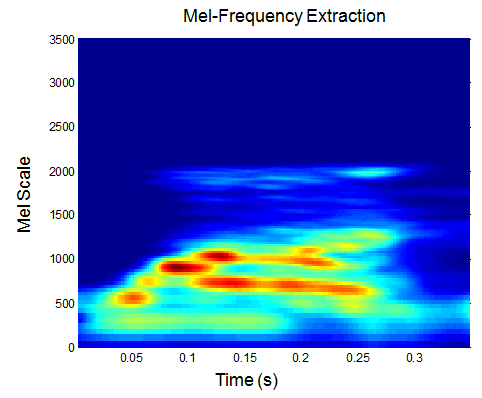
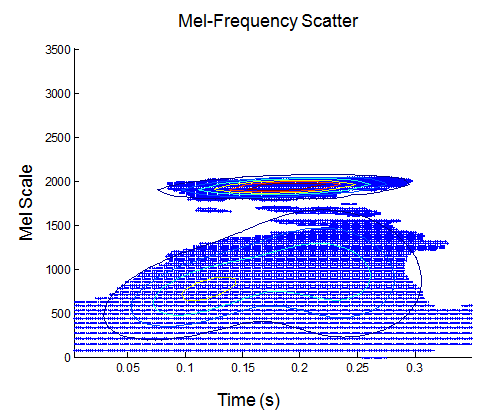
4. This shows the filtered spectrum in the Mel-scale, a logarithmic scale that models human hearing. Corner-frequency of 700 Hz used.
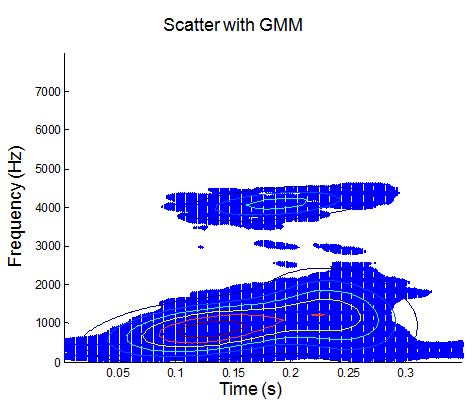
5. Weighted scatter plot with contours of the maximum likelihood GMM overlaid, showing the formants.
6. The GMM generated by the Mel-scale signal differs greatly from the linear-frequency version.
Notification Switch
Would you like to follow the 'Elec 301 projects fall 2011' conversation and receive update notifications?

|
|

|
|

|
|

|
|

|
|

|
|

|
|

|
|

|
|

|