

| << Chapter < Page | Chapter >> Page > |
What type of data is the number of 20 year olds considered to be?
quantitative - discrete
On average, a busy emergency room gets a patient with a shotgun wound about once per week. We are interested in the number of patients with a shotgun wound the emergency room gets per 28 days.
The next two questions refer to the following information:
The probability that a certain slot machine will pay back money when a quarter is inserted is 0.30 . Assume that each play of the slot machine is independent from each other. A person puts in 15 quarters for 15 plays.
Is the expected number of plays of the slot machine that will pay back money greater than, less than or the same as the median? Explain your answer.
greater than
Is it likely that exactly 8 of the 15 plays would pay back money? Justify your answer numerically.
No;
A game is played with the following rules:
Over the long run of playing this game, what are your expected earnings?
You will lose $5
Find whose score was the best, compared to his or her own class. Justify your answer numerically.
Becca
The next two questions refer to the following information:
A random sample of 70 compulsive gamblers were asked the number of days they go to casinos per week. The results are given in the following graph:
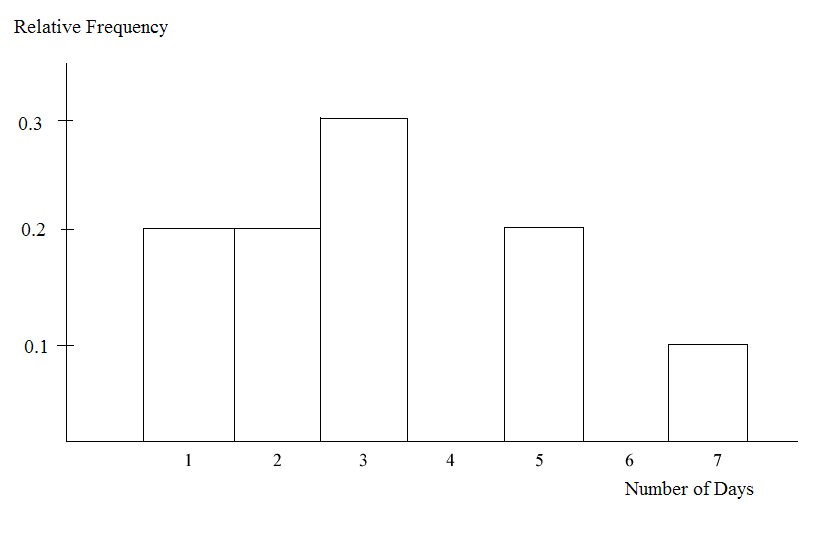
Find the number of responses that were “5".
14
Find the mean, standard deviation, the median, the first quartile, the third quartile and the IQR.
Based upon research at De Anza College, it is believed that about 19% of the student population speaks a language other than English at home.
Suppose that a study was done this year to see if that percent has decreased. Ninety-eight students were randomly surveyed with the following results. Fourteen said that they speak a language other than English at home.
Assume that you are an emergency paramedic called in to rescue victims of an accident. You need to help a patient who is bleeding profusely. The patient is also considered to be a high risk for contracting AIDS. Assume that the null hypothesis is that the patient does
not have the HIV virus. What is a Type I error?
We conclude that the patient does have the HIV virus when, in fact, the patient does not.
It is often said that Californians are more casual than the rest of Americans. Suppose that a survey was done to see if the proportion of Californian professionals that wear jeans to work is greater than the proportion of non-Californian professionals. Fifty of each was surveyed with the following results. 15 Californians wear jeans to work and 6 non-Californians wear jeans to work.
Notification Switch
Would you like to follow the 'Collaborative statistics using spreadsheets' conversation and receive update notifications?

|
|

|
|

|
|

|
|

|
|

|
|

|
|
|
|
|

|
|
|
|