| << Chapter < Page | Chapter >> Page > |
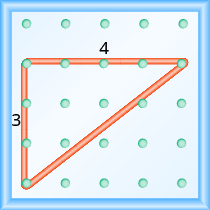
What is the slope of the line on the geoboard shown?

Use the definition of slope.
Start at the left peg and make a right triangle by stretching the rubber band up and to the right to reach the second peg.
Count the rise and the run as shown.
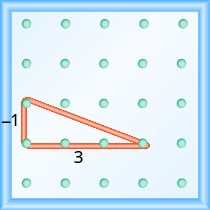
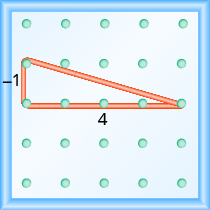
What is the slope of the line on the geoboard shown?

Use the definition of slope.
Start at the left peg and make a right triangle by stretching the rubber band to the peg on the right. This time we need to stretch the rubber band down to make the vertical leg, so the rise is negative.
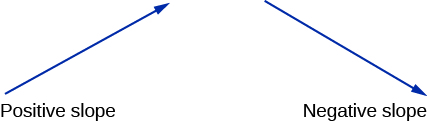
Notice that in the first example, the slope is positive and in the second example the slope is negative. Do you notice any difference in the two lines shown in [link] .
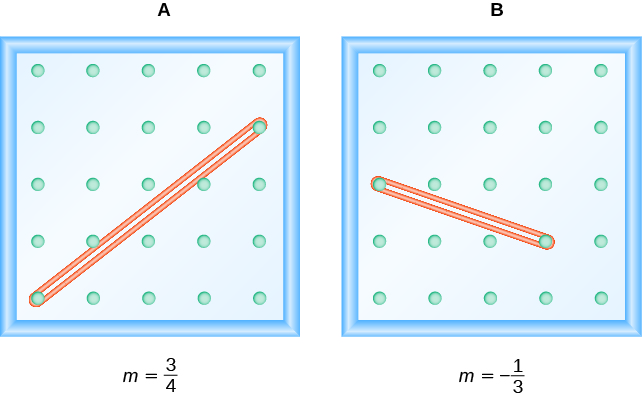
As you read from left to right, the line in Figure A, is going up; it has positive slope. The line Figure B is going down; it has negative slope.
Use a geoboard to model a line with slope
To model a line with a specific slope on a geoboard, we need to know the rise and the run.
| Use the slope formula. | |
| Replace with . |
So, the rise is unit and the run is units.
Start at a peg in the lower left of the geoboard. Stretch the rubber band up
unit, and then right
units.

The hypotenuse of the right triangle formed by the rubber band represents a line with a slope of
Use a geoboard to model a line with slope
| Use the slope formula. | |
| Replace with . |
So, the rise is and the run is
Since the rise is negative, we choose a starting peg on the upper left that will give us room to count down. We stretch the rubber band down
unit, then to the right
units.
The hypotenuse of the right triangle formed by the rubber band represents a line whose slope is
Now we’ll look at some graphs on a coordinate grid to find their slopes. The method will be very similar to what we just modeled on our geoboards.
To find the slope, we must count out the rise and the run . But where do we start?
We locate any two points on the line. We try to choose points with coordinates that are integers to make our calculations easier. We then start with the point on the left and sketch a right triangle, so we can count the rise and run.
Find the slope of the line shown:
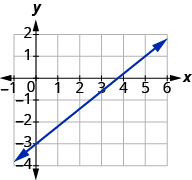
Locate two points on the graph, choosing points whose coordinates are integers. We will use and
Starting with the point on the left,
sketch a right triangle, going from the first point to the second point,
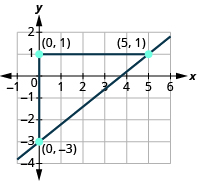 | |
| Count the rise on the vertical leg of the triangle. | The rise is 4 units. |
| Count the run on the horizontal leg. | The run is 5 units. |
| Use the slope formula. | |
| Substitute the values of the rise and run. | |
| The slope of the line is . |
Notice that the slope is positive since the line slants upward from left to right.
Notification Switch
Would you like to follow the 'Prealgebra' conversation and receive update notifications?

|
|

|
|

|
|

|
|

|
|

|
|

|
|

|
|

|
|

|