

| << Chapter < Page | Chapter >> Page > |
| Type of Volunteer | 1-3 Hours | 4-6 Hours | 7-9 Hours | Row Total |
|---|---|---|---|---|
| Community College Students | 111 | 96 | 48 | 255 |
| Four-Year College Students | 96 | 133 | 61 | 290 |
| Nonstudents | 91 | 150 | 53 | 294 |
| Column Total | 298 | 379 | 162 | 839 |
Are the number of hours volunteered independent of the type of volunteer?
The observed table and the question at the end of the problem, "Are the number of hours volunteered independent of the type of volunteer?" tell you this is a test ofindependence. The two factors are number of hours volunteered and type of volunteer . This test is always right-tailed.
: The number of hours volunteered is independent of the type of volunteer.
: The number of hours volunteered is dependent on the type of volunteer.
The expected table is:
| Type of Volunteer | 1-3 Hours | 4-6 Hours | 7-9 Hours |
|---|---|---|---|
| Community College Students | 90.57 | 115.19 | 49.24 |
| Four-Year College Students | 103.00 | 131.00 | 56.00 |
| Nonstudents | 104.42 | 132.81 | 56.77 |
For example, the calculation for the expected frequency for the top left cell is
Calculate the test statistic: (calculator or computer)
Distribution for the test:
Graph:
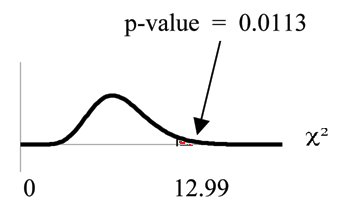
Probability statement:
Compare and the : Since no is given, assume . . .
Make a decision: Since , reject . This means that the factors are not independent.
Conclusion: At a 5% level of significance, from the data, there is sufficient evidence to conclude that the number of hours volunteered and the type of volunteer aredependent on one another.
For the above example, if there had been another type of volunteer, teenagers, whatwould the degrees of freedom be?
TI-83+ and TI-84 calculator: Press the
MATRX key and arrow over to
EDIT . Press
1:[A] . Press
3 ENTER 3 ENTER . Enter the table values by
row from Example 11-6. Press
ENTER after each. Press
2nd QUIT . Press
STAT and arrow over to
TESTS . Arrow down to
C:χ2-TEST . Press
ENTER . You should see
Observed:[A] and Expected:[B] . Arrow down to
Calculate . Press
ENTER . The test statistic is 12.9909 and the
. Do the procedure a second time but arrow down to
Draw instead of
calculate .
De Anza College is interested in the relationship between anxiety level and the need to succeed in school. A random sample of 400 students took a test that measuredanxiety level and need to succeed in school. The table shows the results. De Anza College wants to know if anxiety level and need to succeed in school are independentevents.
| Need to Succeed in School | High
Anxiety |
Med-high
Anxiety |
Medium
Anxiety |
Med-low
Anxiety |
Low
Anxiety |
Row Total |
|---|---|---|---|---|---|---|
| High Need | 35 | 42 | 53 | 15 | 10 | 155 |
| Medium Need | 18 | 48 | 63 | 33 | 31 | 193 |
| Low Need | 4 | 5 | 11 | 15 | 17 | 52 |
| Column Total | 57 | 95 | 127 | 63 | 58 | 400 |
How many high anxiety level students are expected to have a high need to succeed in school?
The column total for a high anxiety level is 57. The row total for high need to succeed in school is 155. The sample size or total surveyed is 400.
The expected number of students who have a high anxiety level and a high need to succeed in school is about 22.
If the two variables are independent, how many students do you expect to have a low need to succeed in school and a med-low level of anxiety?
The column total for a med-low anxiety level is 63. The row total for a low need to succeed in school is 52. The sample size or total surveyed is 400.
Notification Switch
Would you like to follow the 'Collaborative statistics' conversation and receive update notifications?

|
|

|
|

|
|

|
|

|
|

|
|

|
|

|
|

|
|

|