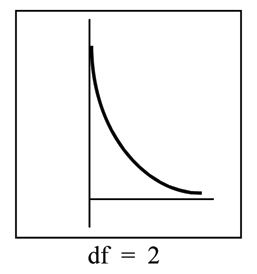
The curve is nonsymmetrical and skewed to the right.
There is a different chi-square curve for each
.
The test statistic for any test is always greater than or equal to zero.
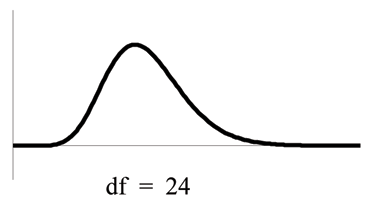
When
, the chi-square curve approximates the normal. For
~
the mean,
and the standard deviation,
.
Therefore,
~
, approximately.
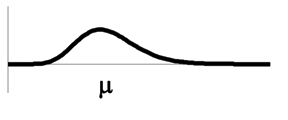
The mean,
, is located just to the right of the peak.
In the next sections, you will learn about four different
applications of the Chi-Square Distribution. These hypothesis tests arealmost always right-tailed tests. In order to understand why the tests are
mostly right-tailed, you will need to look carefully at the actualdefinition of the test statistic. Think about the following while you
study the next four sections. If the expected and observed values are"far" apart, then the test statistic will be "large" and we will reject in
the right tail. The only way to obtain a test statistic very close tozero, would be if the observed and expected values are very, very close to
each other. A left-tailed test could be used to determine if the fit were"too good." A "too good" fit might occur if data had been manipulated or
invented. Think about the implications of right-tailed versus left-tailedhypothesis tests as you learn the applications of the Chi-Square
Distribution.
Step 1: Find the mean. To find the mean, add up all the scores, then divide them by the number of scores. ...
Step 2: Find each score's deviation from the mean. ...
Step 3: Square each deviation from the mean. ...
Step 4: Find the sum of squares. ...
Step 5: Divide the sum of squares by n – 1 or N.
The sample of 16 students is taken. The average age in the sample was 22 years with astandard deviation of 6 years. Construct a 95% confidence interval for the age of the population.
Bhartdarshan' is an internet-based travel agency wherein customer can see videos of the cities they plant to visit. The number of hits daily is a normally distributed random variable with a mean of 10,000 and a standard deviation of 2,400
a. what is the probability of getting more than 12,000 hits?
b. what is the probability of getting fewer than 9,000 hits?
Bhartdarshan'is an internet-based travel agency wherein customer can see videos of the cities they plan to visit. The number of hits daily is a normally distributed random variable with a mean of 10,000 and a standard deviation of 2,400.
a. What is the probability of getting more than 12,000 hits