

| << Chapter < Page | Chapter >> Page > |
In this section we will discuss techniques using spreadsheet for conducting a hypothesis test for two sample means, population standard deviation unknown and for two sample proportions.
In Excel we can use either Data Analysis or we can enter equations as we did for single samples.
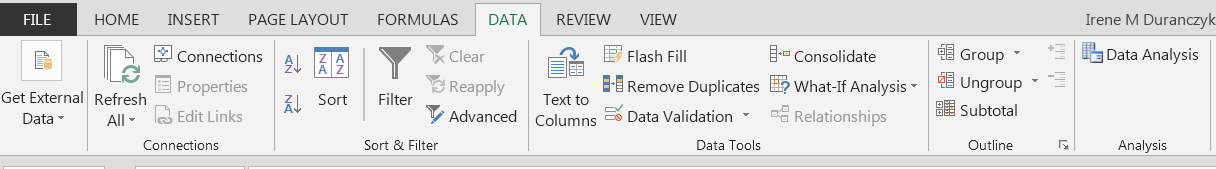
Using Data Analysis you will go to the “DATA” tab on your Excel Ribbon and select (by double clicking) on “Data Analysis.” Below is a screenshot of the Excel Ribbon and the Popup menu that you should see when you open Data Analysis.
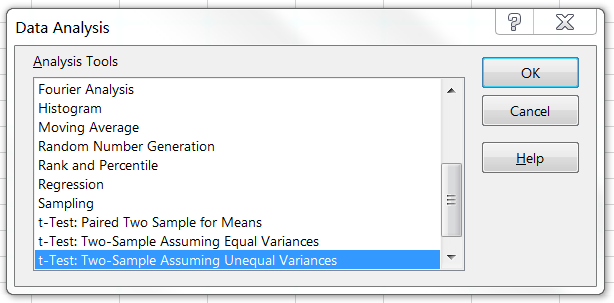
We will be using the t-Test Two-Sample Assuming Unequal Variances. When you select the t-test Two-Sample Assuming Unequal Variance the following popup menu will appear.
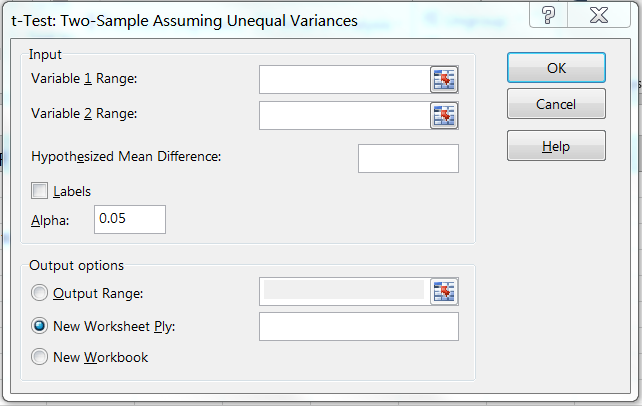
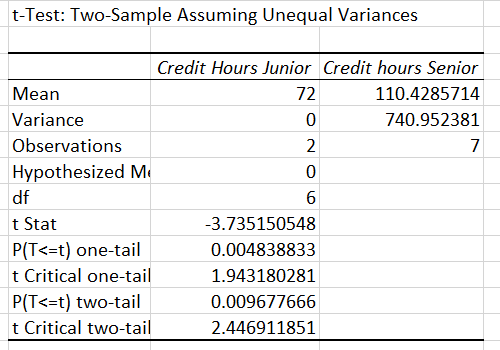
Again you will complete the fields as you did for preparing descriptive statistics or histograms, entering your two data sets in the Input fields, entering your hypothesized mean difference from your null hypothesis (usually “0”), check labels if you are importing the data with the labels (and you should), enter your Alpha level (based on your test significance level), and then select whether you want the results on the page you are working or on a new worksheet. The results will be reported as such.
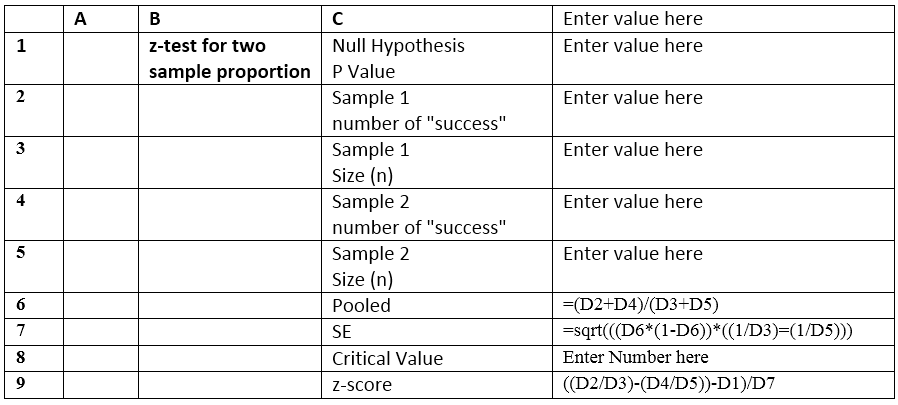
For a two sample proportion you will need to enter your equations into a spreadsheet as you did for a single sample and generate your results.
In an Excel or Google Spreadsheet you would arrange your data as demonstrated in the following columns. The following is labeled as though it was an Excel or Google Spreadsheet.
For Categorical Data:
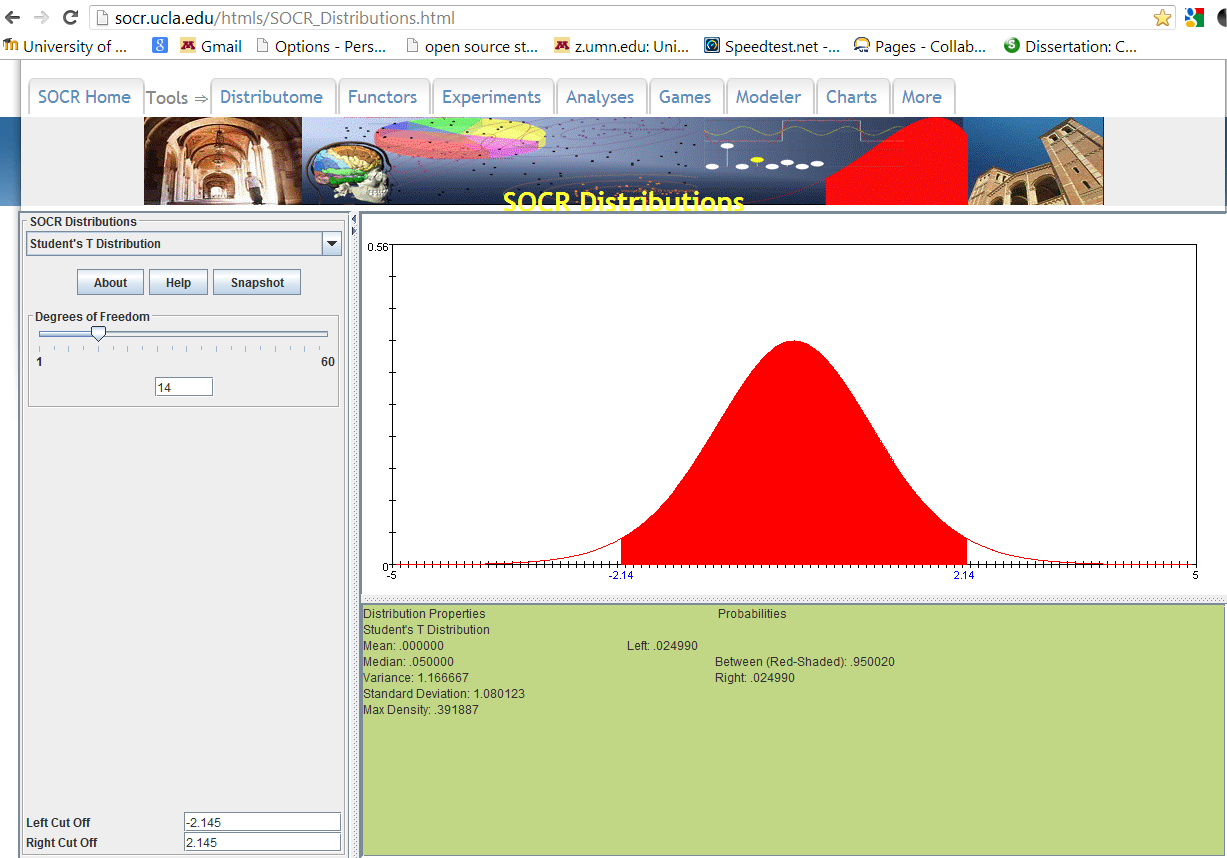
To graph T-test and Z-test use the “Statistics Online Computational Resources (SOCR)”(just as in the previous chapter) at
http://socr.ucla.edu/htmls/SOCR_Distributions.html (just as in the previous chapter) has in the dropdown menu for SOCR distribution the normal distribution and for a Student’s t-distribution. For a normal distribution, you will need to have your mean and standard deviation and again your right and left cut off values (which in this case will be your critical values). For a Student’s t-distribution, you will need to have degrees of freedom and again your right and left cut off values (which in this case will be your critical values). Below is a graph of the Student’s t-distribution. We have used the example from 8.6 Two column Model step by step example for this demonstration. The degrees of freedom were 14 and a 95% confidence interval. We used the t-table to determine the left and right cut off values. In this instance two tailed confidence interval of 95% with 14 degrees for freedom is minus and plus 2.145.
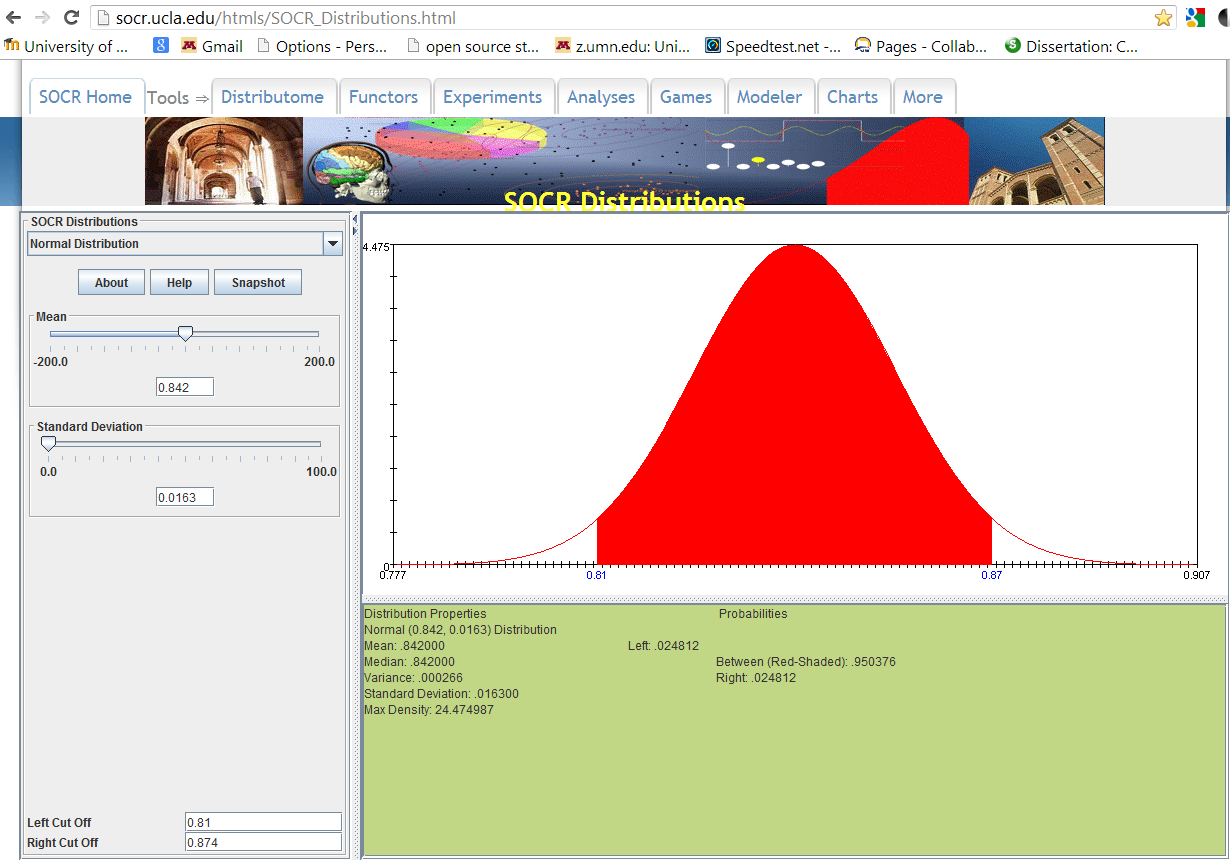
This next example is using the normal distribution for determining the confidence interval for a population proportion. The normal density curve here has the population proportion as the mean (p or p-hat) and the standard deviation (the square root of (p(1-p)/n). We have demonstrated the example 8.8 to show you how this looks in SOCR. For this problem the mean proportion was .842 and the critical z-value for a 95% confidence interval was ± 0.032 or (0.81, 0.874).
At your computer, try to use some of these tools to work out your homework problems or check homework that you have completed to see if the results are the same or similar.
Notification Switch
Would you like to follow the 'Collaborative statistics using spreadsheets' conversation and receive update notifications?

|
|

|
|

|
|

|
|

|
|

|
|

|
|
|
|
|
|
|
|

|