

| << Chapter < Page | Chapter >> Page > |
Suppose a consumer group suspects that the proportion of households that have three cell phones is 30%. A cell phone company has reason to believe that the proportion is not 30%. Before they start a big advertising campaign, they conduct a hypothesis test. Their marketing people survey 150 households with the result that 43 of the households have three cell phones.
Set up the Hypothesis Test:
H 0 : p = 0.30 H a : p ≠ 0.30
Determine the distribution needed:
The random variable is P′ = proportion of households that have three cell phones.
The
distribution for the hypothesis test is
a. The value that helps determine the p -value is p′ . Calculate p′ .
a. p′ = where x is the number of successes and n is the total number in the sample.
x = 43, n = 150
p′ =
b. What is a success for this problem?
b. A success is having three cell phones in a household.
c. What is the level of significance?
c. The level of significance is the preset
α . Since
α is not given, assume that
α = 0.05.
d. Draw the graph for this problem. Draw the horizontal axis. Label and shade appropriately.
Calculate the
p -value.
d.
p -value = 0.7216
e. Make a decision. _____________(Reject/Do not reject) H 0 because____________.
e. Assuming that α = 0.05, α < p -value. The decision is do not reject H 0 because there is not sufficient evidence to conclude that the proportion of households that have three cell phones is not 30%.
Marketers believe that 92% of adults in the United States own a cell phone. A cell phone manufacturer believes that number is actually lower. 200 American adults are surveyed, of which, 174 report having cell phones. Use a 5% level of significance. State the null and alternative hypothesis, find the p -value, state your conclusion, and identify the Type I and Type II errors.
H 0 : p = 0.92
H a : p <0.92
p -value = 0.0046
Because p <0.05, we reject the null hypothesis. There is sufficient evidence to conclude that fewer than 92% of American adults own cell phones.
Type I Error: To conclude that fewer than 92% of American adults own cell phones when, in fact, 92% of American adults do own cell phones (reject the null hypothesis when the null hypothesis is true).
Type II Error: To conclude that 92% of American adults own cell phones when, in fact, fewer than 92% of American adults own cell phones (do not reject the null hypothesis when the null hypothesis is false).
The next example is a poem written by a statistics student named Nicole Hart. The solution to the problem follows the poem. Notice that the hypothesis test is for a single population proportion. This means that the null and alternate hypotheses use the parameter p . The distribution for the test is normal. The estimated proportion p ′ is the proportion of fleas killed to the total fleas found on Fido. This is sample information. The problem gives a preconceived α = 0.01, for comparison, and a 95% confidence interval computation. The poem is clever and humorous, so please enjoy it!
My dog has so many fleas,
They do not come off with ease.
As for shampoo, I have tried many types
Even one called Bubble Hype,
Which only killed 25% of the fleas,
Unfortunately I was not pleased.
I've used all kinds of soap,
Until I had given up hope
Until one day I saw
An ad that put me in awe.
A shampoo used for dogs
Called GOOD ENOUGH to Clean a Hog
Guaranteed to kill more fleas.
I gave Fido a bath
And after doing the math
His number of fleas
Started dropping by 3's!
Before his shampoo
I counted 42.
At the end of his bath,
I redid the math
And the new shampoo had killed 17 fleas.
So now I was pleased.
Now it is time for you to have some fun
With the level of significance being .01,
You must help me figure out
Use the new shampoo or go without?
Set up the hypothesis test:
H 0 : p ≤ 0.25 H a : p >0.25
Determine the distribution needed:
In words, CLEARLY state what your random variable or P′ represents.
P′ = The proportion of fleas that are killed by the new shampoo
State the distribution to use for the test.
Normal:
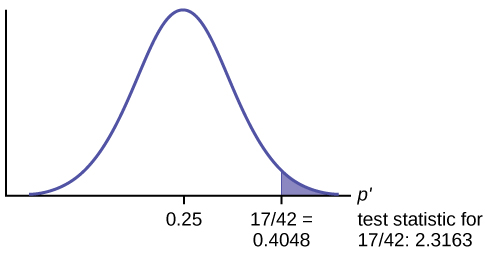
Test Statistic: z = 2.3163
Calculate the p -value using the normal distribution for proportions:
p -value = 0.0103
In one to two complete sentences, explain what the p -value means for this problem.
If the null hypothesis is true (the proportion is 0.25), then there is a 0.0103 probability that the sample (estimated) proportion is 0.4048 or more.
Use the previous information to sketch a picture of this situation. CLEARLY, label and scale the horizontal axis and shade the region(s) corresponding to the p -value.
Compare α and the p -value:
Indicate the correct decision (“reject” or “do not reject” the null hypothesis), the reason for it, and write an appropriate conclusion, using complete sentences.
| alpha | decision | reason for decision |
|---|---|---|
| 0.01 | Do not reject | α < p -value |
Conclusion: At the 1% level of significance, the sample data do not show sufficient evidence that the percentage of fleas that are killed by the new shampoo is more than 25%.
Construct a 95% confidence interval for the true mean or proportion. Include a sketch of the graph of the situation. Label the point estimate and the lower and upper bounds of the confidence interval.
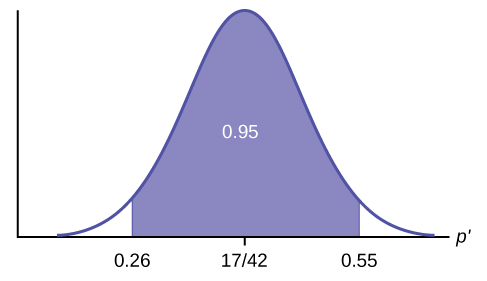
Confidence Interval: (0.26,0.55) We are 95% confident that the true population proportion p of fleas that are killed by the new shampoo is between 26% and 55%.
This test result is not very definitive since the p -value is very close to alpha. In reality, one would probably do more tests by giving the dog another bath after the fleas have had a chance to return.
Notification Switch
Would you like to follow the 'Introduction to statistics i - stat 213 - university of calgary - ver2015revb' conversation and receive update notifications?

|
|

|
|

|
|

|
|

|
|

|
|

|
|

|
|

|
|

|