| << Chapter < Page | Chapter >> Page > |
Two types of medication for hives are being tested to determine if medication A is more effective than medication B. One hundred-eighty-eight out of a random sample of 200 adults given medication A did not have hives 30 minutes after taking the medication. One hundred-eighty out of another random sample of 200 adults given medication B did not have hives 30 minutes after taking the medication. Test at the 1% level of significance.
| Guidelines | Example |
|---|---|
| State the question: State what we want to determine and what level of significance is important in your decision. | We are asked to test the hypothesis that the proportion of adults taking medicine A without hives is more than the proportion of adults taking medicine B without hives after 30 minutes. The significance level is 5%. |
| Plan: Based on the above question(s) and the answer to the following questions, decide which test you will be performing. Is the problem about numerical or categorical data?If the data is numerical is the population standard deviation known? Do you have one group or two groups?What type of model is this? |
We have bivariate, categorical data. We have two independent groups. We have a sample of 200 adults taking medicine A and 200 adults taking medicine B. Our model will be:
|
Hypotheses: State the null and alternative hypotheses in words and then in symbolic form
|
Null hypothesis in words: The null hypothesis is that the true proportion of adults helped by medication A is equal to the true proportion of adults helped by medication B. Null Hypothesis symbolically: H 0 : Proportion Alternative Hypothesis in words: The alternative is that the true proportion of adults helped by medication A is more than the true proportion of adults helped by medication B. Alternative Hypothesis symbolically: H a : Proportion |
| The criteria for the inferential test stated above: Think about the assumptions and check the conditions.If your assumptions include the need for particular types of data distribution, please insert the appropriate graphs or charts if necessary. |
Randomization Condition: The samples are random samples. Independence Assumption: Since we know that a random sample was taken it is reasonable to assume independence. The likelihood of having the medicine work for one person has no bearing on if it will work for another. Independent Groups Assumption: It is reasonable to think that the medicine A group and medicine B group recovery rates are independent of each other. 10% Condition: I assume the number of adults in the community where this was done is more than 4000, so the 200 adults in each group is less than 10% of each population. Success/Failure Condition: Success = no hives Failure = hives (.94)(200) = 188 and (1 - .94)(200) = 12 and (.90)(200) = 180 and (1 - .9)(200) = 20, all values are larger than 10 so the condition is met. |
|
Compute the test statistic: |
The conditions are satisfied, so we will use a hypothesis test for two proportions. We will use a z-test.We need the sample percentages, sample sizes, and p-hat pooled.
|
| Determine the Critical Region(s): Based on your hypotheses are you performing a left-tailed, right-tailed, or two-sided test? | I will perform a right-tailed test. |
|
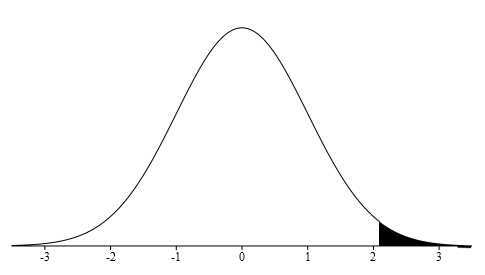
Sketch the test statistic and critical region: Look up the probability on the table. |
|
|
Determine the P-value |
P(z>2.085) = 1 – P(z<2.085) = 1 – 0.9815 = 0.0185>0.01 |
|
State whether you reject or fail to reject the Null hypothesis. |
Since the probability is more than the critical value of 1%, we will fail to reject the null hypothesis. |
| Conclusion: Interpret your result in the proper context, and relate it to the original question. | Since the probability is more than 1%, this is not a rare event and the large probability tells us to fail to reject the null hypothesis. There is no evidence against the null hypothesis. There is no reason to believe that medication A is more effective than medication B. |
|
If you reject the null hypothesis, continue to complete the following |
|
|
Calculate and display your confidence interval for the Alternative hypothesis. |
|
|
State your conclusion based on your confidence interval. |
Notification Switch
Would you like to follow the 'Collaborative statistics using spreadsheets' conversation and receive update notifications?

|
|

|
|

|
|

|
|

|
|

|
|
|
|
|
|
|
|

|
|

|