| << Chapter < Page | Chapter >> Page > |
Step-By-Step Example of a Hypothesis Test for Two Means, sigma unknown (same as Example 1: Independent groups)
The average amount of time boys and girls ages 7 through 11 spend playing sports each day is believed to be the same. A random sample of boys and girls ages 7-11 is selected. An experiment is done, data is collected, resulting in the table below. Is there a difference in the mean amount of time boys and girls ages 7 through 11 play sports each day? Both populations have a normal distribution. Test at the 5% level of significance. (This is the same problem as Example 1 only it is now in our two column model. You will have a copy of this form in your course site and are encouraged to use this process when you conduct a hypothesis test.)
| Sample size | Average Number of Hours Playing Sports Per Day | Sample Standard Deviation | |
|---|---|---|---|
| Girls | 9 | 2 hours | |
| Boys | 16 | 3.2 hours | 1.00 |
| Guidelines | Example |
|---|---|
|
We are asked to test the hypothesis that the mean time boys and girls between 7 and 11 spend playing sports each day is the same. We do not know the population standard deviations. The significance level is 5%. |
|
We have bivariate, quantitative data. We have two independent groups. We have a sample of 9 for the girls and 16 for the boys. We do not know the population standard deviations. Therefore, we can perform a Students t-Test for independent samples, with approximately 18.8462 degrees of freedom. Our model will be: |
|
Null hypothesis in words: The null hypothesis is that the true mean time playing sports each day of girls is equal to the true mean time each day of boys playing sports.
|
|
Randomization Condition: The samples are random samples.
|
|
Compute the test statistic: |
The conditions are satisfied and σ is unknown, so we will use a hypothesis test for two means with unknown population standard deviations. We will use a t-test.We need the sample means, sample standard deviations and Standard Error (SE).
|
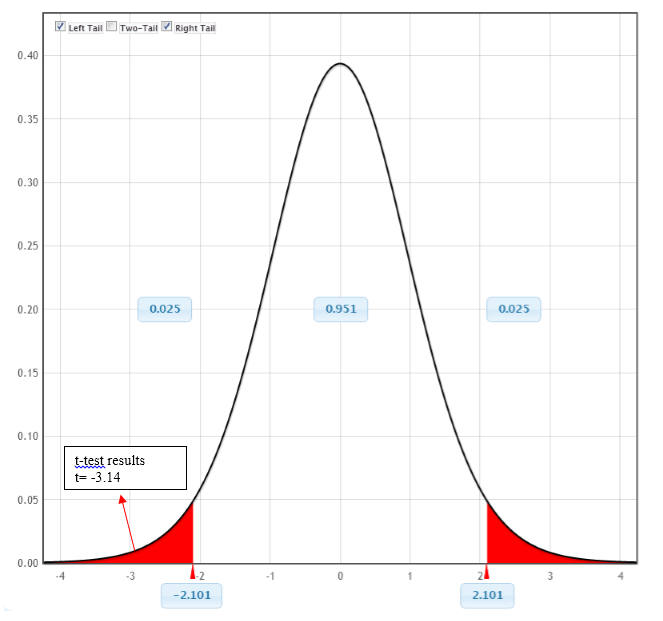
| Determine the Critical Region(s): Based on your hypotheses are you performing a left-tailed, right-tailed, or tw0-sided test? | I will perform a two tailed test. I am only concerned with the scores being different than each other. |
|
Sketch the test statistic and critical region: Look up the probability on the table. |
|
|
Determine the P-value |
P(t<-2.804)<0.02 We used a two tailed probability. |
|
State whether you reject or fail to reject the Null hypothesis. |
Since the probability is less than the critical value of 5%, we will reject the null hypothesis. |
| Conclusion: Interpret your result in the proper context, and relate it to the original question. | Since the probability is less than 5%, this is considered a rare event and the small probability tells us to reject the null hypothesis. There is sufficient evidence that the mean number of hours boys aged 7 to 11 play sports per day is different than the mean number of hours girls aged 7 to 11 play sports per day. The p-value tells us that there is less than 2% chance of obtaining our sample difference in means of 1.2 hours less for girls if the null hypothesis is true. This is a rare event. |
|
If you reject the null hypothesis, continue to complete the following |
|
|
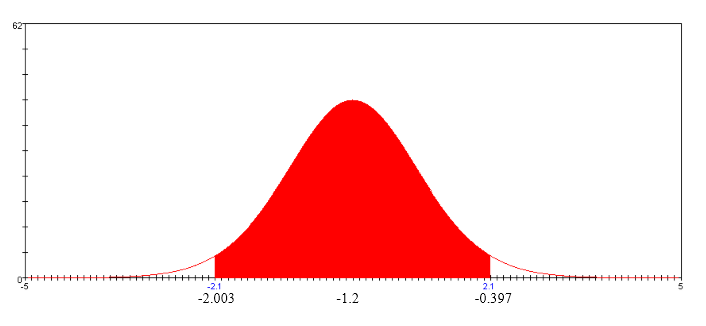
Calculate and display your confidence interval for the Alternative hypothesis. |
The confidence interval is t ± t
* (SE) =-1.2 ± 2.101(0.382) =-1.2 ± 0.803 (-2.003, -0.397)
|
|
State your conclusion based on your confidence interval. |
I am 95% confident that the true mean difference in the number of hours girls 7 to 11 play sports each day is between 0.301 and 2.099 hours less than the number of hour boys 7 to 11 play sports each day. |
Notification Switch
Would you like to follow the 'Collaborative statistics using spreadsheets' conversation and receive update notifications?

|
|

|
|

|
|

|
|

|
|

|
|

|
|
|
|
|

|
|

|