<< Chapter < Page Chapter >> Page >
This module provides an overview of Comparing Two Independent Population Means with Unknown Population Standard Deviations as a part of Collaborative Statistics collection (col10522) by Barbara Illowsky and Susan Dean.
  1. The two independent samples are simple random samples from two distinct populations.
  2. Both populations are normally distributed with the population means and standard deviations unknown unless the sample sizes are greater than 30. In that case, the populations need not be normally distributed.
The test comparing two independent population means with unknown and possibly unequal population standard deviations is called the Aspin-Welch t-test. The degrees of freedom formula was developed by Aspin-Welch.

The comparison of two population means is very common. A difference between the two samples depends on both the means and the standard deviations. Verydifferent means can occur by chance if there is great variation among the individual samples. In order to account for the variation, we take the difference of the samplemeans, X 1 - X 2 , and divide by the standard error (shown below) in order to standardize the difference. The result is a t-score test statistic (shown below).

Because we do not know the population standard deviations, we estimate them using the two sample standard deviations from our independent samples. For thehypothesis test, we calculate the estimated standard deviation, or standard error , of the difference in sample means , X 1 - X 2 .

The standard error is:

( S 1 ) 2 n 1 + ( S 2 ) 2 n 2

The test statistic (t-score) is calculated as follows:

T-score

( x 1 - x 2 ) - ( μ 1 - μ 2 ) ( S 1 ) 2 n 1 + ( S 2 ) 2 n 2

    Where:

  • s 1 and s 2 , the sample standard deviations, are estimates of σ 1 and σ 2 , respectively.
  • σ 1 and σ 2 are the unknown population standard deviations.
  • x 1 and x 2 are the sample means. μ 1 and μ 2 are the population means.

The degrees of freedom (df) is a somewhat complicated calculation. However, a computer or calculator calculates it easily. The dfs are not always a whole number. The test statisticcalculated above is approximated by the student's-t distribution with dfs as follows:

Degrees of freedom

df = [ ( s 1 ) 2 n 1 + ( s 2 ) 2 n 2 ] 2 1 n 1 1 · [ ( s 1 ) 2 n 1 ] 2 + 1 n 2 1 · [ ( s 2 ) 2 n 2 ] 2

When both sample sizes n 1 and n 2 are five or larger, the student's-t approximation is very good. Notice that the sample variances s 1 2 and s 2 2 are not pooled. (If the question comes up, do not pool the variances.)

It is not necessary tocompute this by hand. A calculatoror computer easily computes it.

Independent groups

The average amount of time boys and girls ages 7 through 11 spend playing sports each day is believed to be the same. Anexperiment is done, data is collected, resulting in the table below. Both populations have a normal distribution.

Sample Size Average Number of Hours Playing Sports Per Day Sample Standard Deviation
Girls 9 2 hours 0.75
Boys 16 3.2 hours 1.00

Is there a difference in the mean amount of time boys and girls ages 7 through 11 play sports each day? Test at the 5% level of significance.

The population standard deviations are not known. Let g be the subscript for girls and b be the subscript for boys. Then, μ g is the population mean for girls and μ b is the population mean for boys. This is a test of two independent groups , two population means .

Random variable : X g - X b = difference in the sample mean amount of time girls and boys play sports each day.

H o : μ g = μ b μ g μ b = 0

H a : μ g μ b μ g μ b 0

The words "the same" tell you H o has an "=". Since there are no other words to indicate H a , then assume "is different." This is a two-tailed test.

Distribution for the test: Use t df where df is calculated using the df formula for independent groups, two population means. Using a calculator, df is approximately 18.8462. Do not pool the variances.

Calculate the p-value using a student's-t distribution: p-value = 0.0054

Graph:
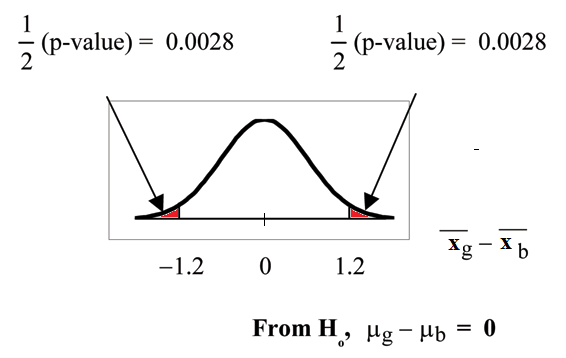
Normal distribution curve of the difference in the average amount of time girls and boys play sports all day with values of -1.2, 0, and 1.2 on the x-axis. Two vertical upward lines extend from points -1.2 and 1.2 to the curve. The 1/2(p-values) areas are indicated on either side of these values.

s g = 0.75

s b = 1

So, x g - x b = 2 - 3.2 = - 1.2

Half the p-value is below -1.2 andhalf is above 1.2.

Make a decision: Since α > p-value, reject H o .

This means you reject μ g = μ b . The means are different.

Conclusion: At the 5% level of significance, the sample data show there is sufficient evidence to conclude that the mean number of hours that girls and boys aged 7through 11 play sports per day is different (mean number of hours boys aged 7 through 11 play sports per day is greater than the mean number of hours played by girls OR the mean number of hours girls aged 7 through 11 play sports per day is greater than the mean number of hours played by boys).

TI-83+ and TI-84: Press STAT . Arrow over to TESTS and press 4:2-SampTTest . Arrow over to Stats and press ENTER . Arrow down and enter 2 for the first sample mean, 0.75 for Sx1, 9 for n1, 3.2 for the second sample mean, 1 for Sx2, and 16 for n2. Arrow down to μ1: and arrow to does not equal μ2. Press ENTER . Arrow down to Pooled: and No . Press ENTER . Arrow down to Calculate and press ENTER . The p-value is p = 0.0054, the dfs are approximately 18.8462, and the teststatistic is -3.14. Do the procedure again but instead of Calculate do Draw.
Got questions? Get instant answers now!

A study is done by a community group in two neighboring colleges to determine which one graduates students with more math classes. College A samples11 graduates. Their average is 4 math classes with a standard deviation of 1.5 math classes. College B samples 9 graduates. Their average is 3.5 math classes with astandard deviation of 1 math class. The community group believes that a student who graduates from college A has taken more math classes, on the average. Both populations have a normal distribution. Test at a 1% significance level.Answer the following questions.

Is this a test of two means or two proportions?

two means

Got questions? Get instant answers now!

Are the populations standard deviations known or unknown?

unknown

Got questions? Get instant answers now!

Which distribution do you use to perform the test?

student's-t

Got questions? Get instant answers now!

What is the random variable?

X A - X B

Got questions? Get instant answers now!

What are the null and alternate hypothesis?

  • H o : μ A μ B
  • H a : μ A > μ B
Got questions? Get instant answers now!

Is this test right, left, or two tailed?

right

Got questions? Get instant answers now!

What is the p-value?

0.1928

Got questions? Get instant answers now!

Do you reject or not reject the null hypothesis?

Do not reject.

Got questions? Get instant answers now!

Conclusion:

At the 1% level of significance, from the sample data, there is not sufficient evidence to conclude that a student who graduates from college A hastaken more math classes, on the average, than a student who graduates from college B.

Got questions? Get instant answers now!

Questions & Answers

if three forces F1.f2 .f3 act at a point on a Cartesian plane in the daigram .....so if the question says write down the x and y components ..... I really don't understand
Syamthanda Reply
hey , can you please explain oxidation reaction & redox ?
Boitumelo Reply
hey , can you please explain oxidation reaction and redox ?
Boitumelo
for grade 12 or grade 11?
Sibulele
the value of V1 and V2
Tumelo Reply
advantages of electrons in a circuit
Rethabile Reply
we're do you find electromagnetism past papers
Ntombifuthi
what a normal force
Tholulwazi Reply
it is the force or component of the force that the surface exert on an object incontact with it and which acts perpendicular to the surface
Sihle
what is physics?
Petrus Reply
what is the half reaction of Potassium and chlorine
Anna Reply
how to calculate coefficient of static friction
Lisa Reply
how to calculate static friction
Lisa
How to calculate a current
Tumelo
how to calculate the magnitude of horizontal component of the applied force
Mogano
How to calculate force
Monambi
a structure of a thermocouple used to measure inner temperature
Anna Reply
a fixed gas of a mass is held at standard pressure temperature of 15 degrees Celsius .Calculate the temperature of the gas in Celsius if the pressure is changed to 2×10 to the power 4
Amahle Reply
How is energy being used in bonding?
Raymond Reply
what is acceleration
Syamthanda Reply
a rate of change in velocity of an object whith respect to time
Khuthadzo
how can we find the moment of torque of a circular object
Kidist
Acceleration is a rate of change in velocity.
Justice
t =r×f
Khuthadzo
how to calculate tension by substitution
Precious Reply
hi
Shongi
hi
Leago
use fnet method. how many obects are being calculated ?
Khuthadzo
khuthadzo hii
Hulisani
how to calculate acceleration and tension force
Lungile Reply
you use Fnet equals ma , newtoms second law formula
Masego
please help me with vectors in two dimensions
Mulaudzi Reply
how to calculate normal force
Mulaudzi
Got questions? Join the online conversation and get instant answers!
Jobilize.com Reply
Practice Key Terms 3

Get Jobilize Job Search Mobile App in your pocket Now!

Get it on Google Play Download on the App Store Now


Source:  OpenStax, Collaborative statistics. OpenStax CNX. Jul 03, 2012 Download for free at http://cnx.org/content/col10522/1.40
Google Play and the Google Play logo are trademarks of Google Inc.

Notification Switch

Would you like to follow the 'Collaborative statistics' conversation and receive update notifications?

Ask