<< Chapter < Page Chapter >> Page >
This module provides practice problems designed to develop some concepts related to graphing.

The following graph shows the temperature throughout the month of March. Actually, I just made this graph up—the numbers do not actually reflect the temperature throughout the month of March. We’re just pretending, OK?

A graph shows the temperature throughout the month of March

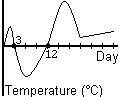
Give a weather report for the month of March, in words.

Got questions? Get instant answers now!

On what days was the temperature exactly 0°C?

Got questions? Get instant answers now!

On what days was the temperature below freezing?

Got questions? Get instant answers now!

On what days was the temperature above freezing?

Got questions? Get instant answers now!

What is the domain of this graph?

Got questions? Get instant answers now!

During what time periods was the temperature going up?

Got questions? Get instant answers now!

During what time periods was the temperature going down?

Got questions? Get instant answers now!

Mary started a company selling French Fries over the Internet. For the first 3 days, while she worked on the technology, she lost $100 per day. Then she opened for business. People went wild over her French Fries! She made $200 in one day, $300 the day after that, and $400 the day after that. The following day she was sued by an angry customer who discovered that Mary had been using genetically engineered potatoes. She lost $500 in the lawsuit that day, and closed up her business. Draw a graph showing Mary’s profits as a function of days.

Got questions? Get instant answers now!

Fill in the following table. Then draw graphs of the functions y = x 2 size 12{y=x rSup { size 8{2} } } {} , y = x 2 + 2 size 12{y=x rSup { size 8{2} } +2} {} , y = x 2 1 size 12{y=x rSup { size 8{2} } - 1} {} , y = ( x + 3 ) 2 size 12{y= \( x+3 \) rSup { size 8{2} } } {} , y = 2x 2 size 12{y=2x rSup { size 8{2} } } {} , and y = x 2 size 12{y= - x rSup { size 8{2} } } {} .

x x 2 size 12{x rSup { size 8{2} } } {} x 2 + 2 size 12{x rSup { size 8{2} } +2} {} x 2 1 size 12{x rSup { size 8{2} } - 1} {} ( x + 3 ) 2 size 12{ \( x+3 \) rSup { size 8{2} } } {} 2x 2 size 12{2x rSup { size 8{2} } } {} x 2 size 12{ - x rSup { size 8{2} } } {}
-3
-2
-1
0
1
2
3

Now describe in words what happened…

  • How did adding 2 to the function change the graph?
  • How did subtracting 1 from the function change the graph?
  • How did adding three to x change the graph?
  • How did doubling the function change the graph?
  • How did multiplying the graph by –1 change the graph?
  • By looking at your graphs, estimate the point of intersection of the graphs y = x 2 size 12{y=x rSup { size 8{2} } } {} and y = ( x + 3 ) 2 size 12{y= \( x+3 \) rSup { size 8{2} } } {} . What does this point represent?
Got questions? Get instant answers now!

Get Jobilize Job Search Mobile App in your pocket Now!

Get it on Google Play Download on the App Store Now


Source:  OpenStax, Advanced algebra ii: activities and homework. OpenStax CNX. Sep 15, 2009 Download for free at http://cnx.org/content/col10686/1.5
Google Play and the Google Play logo are trademarks of Google Inc.

Notification Switch

Would you like to follow the 'Advanced algebra ii: activities and homework' conversation and receive update notifications?

Ask