<< Chapter < Page Chapter >> Page >
  • Identify the equation of a parabola in standard form with given focus and directrix.
  • Identify the equation of an ellipse in standard form with given foci.
  • Identify the equation of a hyperbola in standard form with given foci.
  • Recognize a parabola, ellipse, or hyperbola from its eccentricity value.
  • Write the polar equation of a conic section with eccentricity e .
  • Identify when a general equation of degree two is a parabola, ellipse, or hyperbola.

Conic sections have been studied since the time of the ancient Greeks, and were considered to be an important mathematical concept. As early as 320 BCE, such Greek mathematicians as Menaechmus, Appollonius, and Archimedes were fascinated by these curves. Appollonius wrote an entire eight-volume treatise on conic sections in which he was, for example, able to derive a specific method for identifying a conic section through the use of geometry. Since then, important applications of conic sections have arisen (for example, in astronomy), and the properties of conic sections are used in radio telescopes, satellite dish receivers, and even architecture. In this section we discuss the three basic conic sections, some of their properties, and their equations.

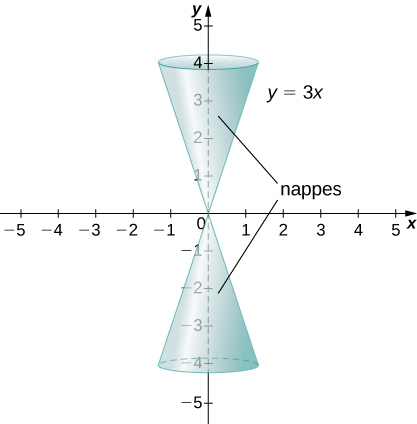
Conic sections get their name because they can be generated by intersecting a plane with a cone. A cone has two identically shaped parts called nappes . One nappe is what most people mean by “cone,” having the shape of a party hat. A right circular cone can be generated by revolving a line passing through the origin around the y -axis as shown.

The line y = 3x is drawn and then rotated around the y axis to create two nappes, that is, a cone that is both above and below the x axis.
A cone generated by revolving the line y = 3 x around the y -axis.

Conic sections are generated by the intersection of a plane with a cone ( [link] ). If the plane is parallel to the axis of revolution (the y -axis), then the conic section    is a hyperbola. If the plane is parallel to the generating line, the conic section is a parabola. If the plane is perpendicular to the axis of revolution, the conic section is a circle. If the plane intersects one nappe at an angle to the axis (other than 90 ° ) , then the conic section is an ellipse.

This figure has three figures. The first figure shows a plain cone with two nappes. The second figure shows a cone with a plane through one nappes and the circle at the top, which creates a parabola. There is also a circle, which occurs when a plane intersects one of the nappes while parallel to the circular bases. There is also an ellipse, which occurs when a plane insects one of the nappes while not parallel to one of the circular bases. Note that the circle and the ellipse are bounded by the edges of the cone on all sides. The last figure shows a hyperbola, which is obtained when a plane intersects both nappes.
The four conic sections. Each conic is determined by the angle the plane makes with the axis of the cone.

Parabolas

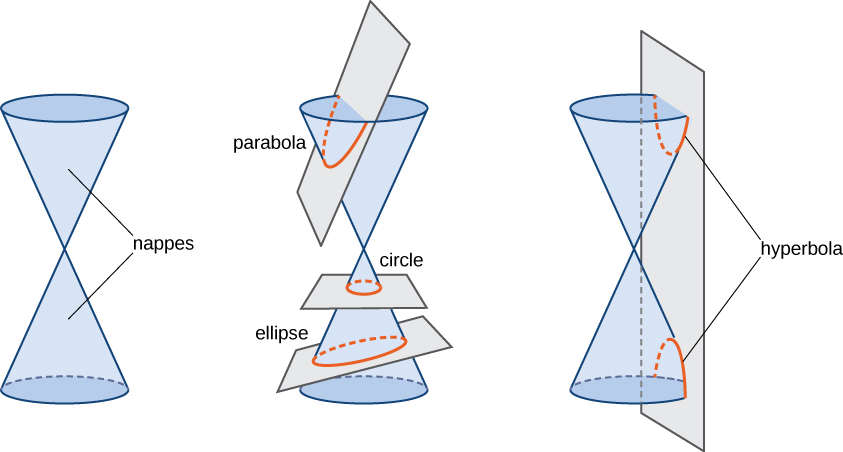
A parabola is generated when a plane intersects a cone parallel to the generating line. In this case, the plane intersects only one of the nappes. A parabola can also be defined in terms of distances.

Definition

A parabola is the set of all points whose distance from a fixed point, called the focus    , is equal to the distance from a fixed line, called the directrix    . The point halfway between the focus and the directrix is called the vertex    of the parabola.

A graph of a typical parabola appears in [link] . Using this diagram in conjunction with the distance formula, we can derive an equation for a parabola. Recall the distance formula: Given point P with coordinates ( x 1 , y 1 ) and point Q with coordinates ( x 2 , y 2 ) , the distance between them is given by the formula

d ( P , Q ) = ( x 2 x 1 ) 2 + ( y 2 y 1 ) 2 .

Then from the definition of a parabola and [link] , we get

Questions & Answers

how do you get the 2/50
Abba Reply
number of sport play by 50 student construct discrete data
Aminu Reply
width of the frangebany leaves on how to write a introduction
Theresa Reply
Solve the mean of variance
Veronica Reply
Step 1: Find the mean. To find the mean, add up all the scores, then divide them by the number of scores. ... Step 2: Find each score's deviation from the mean. ... Step 3: Square each deviation from the mean. ... Step 4: Find the sum of squares. ... Step 5: Divide the sum of squares by n – 1 or N.
kenneth
what is error
Yakuba Reply
Is mistake done to something
Vutshila
Hy
anas
hy
What is the life teble
anas
hy
Jibrin
statistics is the analyzing of data
Tajudeen Reply
what is statics?
Zelalem Reply
how do you calculate mean
Gloria Reply
diveving the sum if all values
Shaynaynay
let A1,A2 and A3 events be independent,show that (A1)^c, (A2)^c and (A3)^c are independent?
Fisaye Reply
what is statistics
Akhisani Reply
data collected all over the world
Shaynaynay
construct a less than and more than table
Imad Reply
The sample of 16 students is taken. The average age in the sample was 22 years with astandard deviation of 6 years. Construct a 95% confidence interval for the age of the population.
Aschalew Reply
Bhartdarshan' is an internet-based travel agency wherein customer can see videos of the cities they plant to visit. The number of hits daily is a normally distributed random variable with a mean of 10,000 and a standard deviation of 2,400 a. what is the probability of getting more than 12,000 hits? b. what is the probability of getting fewer than 9,000 hits?
Akshay Reply
Bhartdarshan'is an internet-based travel agency wherein customer can see videos of the cities they plan to visit. The number of hits daily is a normally distributed random variable with a mean of 10,000 and a standard deviation of 2,400. a. What is the probability of getting more than 12,000 hits
Akshay
1
Bright
Sorry i want to learn more about this question
Bright
Someone help
Bright
a= 0.20233 b=0.3384
Sufiyan
a
Shaynaynay
How do I interpret level of significance?
Mohd Reply
It depends on your business problem or in Machine Learning you could use ROC- AUC cruve to decide the threshold value
Shivam
how skewness and kurtosis are used in statistics
Owen Reply
yes what is it
Taneeya
Got questions? Join the online conversation and get instant answers!
Jobilize.com Reply

Get Jobilize Job Search Mobile App in your pocket Now!

Get it on Google Play Download on the App Store Now


Source:  OpenStax, Calculus volume 3. OpenStax CNX. Feb 05, 2016 Download for free at http://legacy.cnx.org/content/col11966/1.2
Google Play and the Google Play logo are trademarks of Google Inc.

Notification Switch

Would you like to follow the 'Calculus volume 3' conversation and receive update notifications?

Ask