

| << Chapter < Page | Chapter >> Page > |
Results and Conclusions
We find that given several different real world situations, we can effectively represent their blurring effects with a point spread function. This point spread function is critical in our ability to recover our original image. In our case, we have chosen several different situations with known blurring kernels to test the ability of the FTVd algorithm.
The FTVd algorithm is effective at recovering our original image, but this is highly dependent on the amount of blur and noise present in the image. With exceeding large amount of noise corruption, we will not be able to recover our signal. However, even with large amounts of blur, we still retrieve the image as long as we can effectively create a kernel to represent the functions that have acted on our signal.
For each of our images, we measured the peak signal-to-noise ratio (PSNR), which compares the similarity of two images pixel-by-pixel. The value of one pixel in image A is subtracted from its value in image B. This difference is squared, which gives us a positive number called the squared error for the pixel. We repeat this process across all pixels in both images to find the sum of these squared errors, and divide by the number of pixels. This gives the mean squared error (MSE). If the two images are identical, the difference between each pixel will be zero for all the pixels. Dividing by the number of pixels, will give a MSE of zero.
PSNR is calculated using the following equation:
In our case, MAX = 1.
The following image shows the recovered image of handshake with L2 noise PSNR=41.97 dB:

The next image shows the recovered version of our foreground/background blur with L1 noise PSNR=34.50 dB:

The following graph shows the PSNR calculated for varying amounts of linear motion blur. It demonstrates the ability for an effective recovery every time. We can see that the PSNR of the recovered images was always with the range of about 30-50 dB, which compares favorably to the PSNR of common lossy compression ratios.

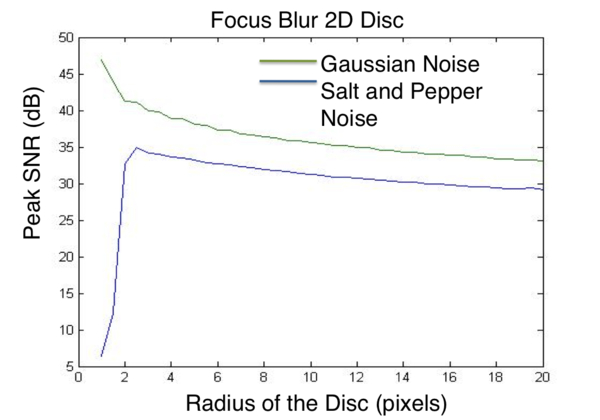
The next graph shows similar results for varied radii of our 2D disc. The graph shows resulting PSNR well within the range of 30-50dB.
The following table shows the PSNR for each all of our recovered images from their corresponding blurry and noisy observations.
| PSNR of Blurry and Noisy Observation (dB) | PSNR of Recovered Images (dB) | |||
| Blur Kernel | L1 Salt and Pepper | L2 Gaussian Noise | L1 Salt and Pepper | L2 Gaussian Noise |
| Linear Motion | 14.9163 | 23.6375 | 30.4995 | 36.5378 |
| Handshake | 14.9375 | 24.2680 | 32.1562 | 41.9656 |
| Out of Focus | 14.9695 | 28.8440 | 33.1344 | 38.0992 |
| Foreground/ Background | 15.0063 | 30.5060 | 34.5034 | 32.3670 |
Areas for Future Study
As the results show, the FTVd algorithm can be used to quickly deblur noisy images and is robust enough to handle moderate to severe amounts of blur while achieving an acceptable PSNR. Underlying these results, however, is the fundamental assumption that we have an accurate representation of the blur kernel. This is to say, the algorithm can reconstruct the clean image with some fidelity if we actually know or can determine the blur kernel. However, we still sacrifice some of the fine detail or sharp edges in our recovered image.
One of the methods to treat focus blur is to implement a coded aperture into the hardware of the camera lens. In this approach, a patterned mask is placed inside of the lens at the plane of the aperture. Out-of-focus photos taken with this setup will generate a specific pattern on the camera sensor, which can be used to produce a kernel.
To treat handshake blur, direct measurement of the blur kernel is possible using a high-speed camera and sensors. The problem of handshake blur was simplified in our study, as there are multiple factors that account for blur in an image. A more realistic handshake blur kernel would involve different kernels for different parts of the image. Image deblurring using these so-called “spatially-varying point spread functions” would operate much the same as in our study but would run on sections of the photo sequentially, inputting the kernel associated with the section of the photo examined at the time [3].
Notification Switch
Would you like to follow the 'Elec 301 projects fall 2011' conversation and receive update notifications?

|
|

|
|

|
|

|
|

|
|

|
|

|
|

|
|

|
|
|
|