<< Chapter < Page Chapter >> Page >
The creation of this content was supported in some part by NSF grant 0538934.

Waveform chart

Waveform Charts provide a historical graphical representation of numeric data.

The following example will build a simple G program that will allow you to chart a sine wave as it is being generated on a point-by-point basis using the equation:

y i = sin ( 0.2 x i )
A waveform chart with containing a Sine Wave. The amplitude of the Sine wave is 1.
Waveform Chart

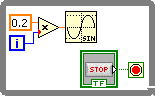
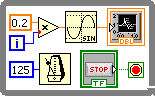
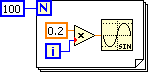
Start with a while loop and add into it a Multiply and Sine functions, a numeric constant with value 0.2 and a Boolean control to stop the loop when its value is True. Arrange the diagram to look as in [link] .

A diagram of a 'while loop for waveform chart'. The diagram consists of several icons from left to right there is an orange box containing '0.2' and underneath this there is a blue box containg 'i'. lines connect these icons to a triangular box containing 'x'. A line then connects this triangle to a wave icon. Underneath this row of icons, there is a 'stop' icon connected to a red button icon.
While Loop For Waveform Chart

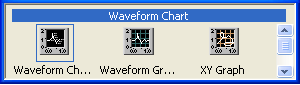
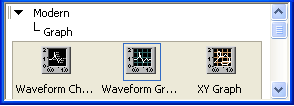
To select a waveform chart, right click on the Front Panel window and select Waveform Chart from the Controls>>Modern>>Graph menu.

A row of icons. The row is labeled 'waveform chart'.
Selecting Waveform Chart

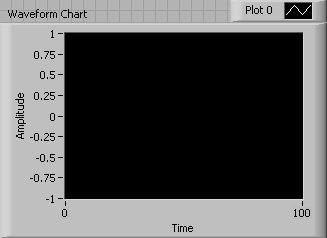
This places the Waveform Chart in the Front Panel window.

An empty waveform chart.
Waveform Chart in Front Panel window

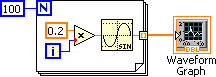
In the Block Diagram window, make sure that the Waveform Chart terminal is inside the while loop. Wire the output of the Sine function to this terminal.

Notice that Waveform Chart terminal is that of a numeric output.

A diagram of a 'while loop for waveform chart'. The diagram consists of several icons from left to right there is an orange box containing '0.2' and underneath this there is a blue box containg 'i'. lines connect these icons to a triangular box containing 'x'. A line then connects this triangle to a wave icon and finally the wave icon is connected to a graph icon. Underneath this row of icons, there is a 'stop' icon connected to a red button icon.
Waveform Chart Terminal

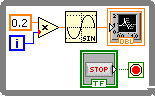
Most modern computers will run this program too fast. Thus, before this program is executed, a delay of 125 milliseconds will be inserted in the while loop. This will allow users to see how the Waveform Chart operates as data samples are plotted in the chard.

From the Functions>>Programming>>Timing select Wait Until Next ms Multiple . This will put the while loop to sleep for the indicated number of milliseconds.

A row of four icons labeled from left to right, 'tick count (ms)', 'wait (ms)', and 'wait until ne..'. This row is listed under the level headers Programming and Timing.
Wait Until Next ms Multiple

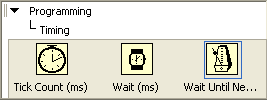
Drop the Wait Until Next ms Multiple function inside the loop and wire a constant to it with the value 125. This will delay the loop for 125 milliseconds. The final Waveform Chart program is shown in [link] .

A diagram of a 'while loop for waveform chart'. The diagram consists of several icons from left to right there is an orange box containing '0.2' and underneath this there is a blue box containg 'i'. lines connect these icons to a triangular box containing 'x'. A line then connects this triangle to a wave icon and finally the wave icon is connected to a graph icon. Underneath this row of icons, there is another row of icons from left to right there is a blue box containing '125' that is also connected to a metronome icon. There is also a 'stop' icon connected to a red button icon.
Waveform Chart Program

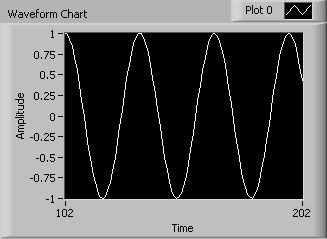
The default graphing mode of the Waveform Chart is autoscaling. You will notice the auto-scaling property when the program first begins to run and the y-axis, labeled Amplitude, updates automatically as new numerical values are aggregated and displayed on the chart.

A diagram of a waveform chart autoscaling.
Waveform Chart Autoscaling

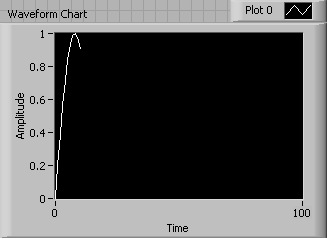
As the program continues to run, the graph continues to build as per the values associated with the x-axis, labeled Time , which correspond to the index value of the equations.

A diagram of Accumulating values for the Waveform Chart.
Accumulating Values for the Waveform Chart

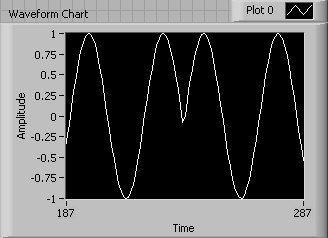
As the program continues to run, the autoscaling property also applies to the x-axis. Noticed the updated x-axis. For this example, the x-axis will continue updating so as long as the program is running. This gives the appearance of a scrolling strip chart.

A diagram showing a scrolling X-axis.
Scrolling X-Axis

Stopping and restarting the G program retains the numeric history and continues to aggregate the values for display.

A waveform chart containing a sine wave with an applitude of 1. In the middle of the wave, the bottom of the trough exists at y=0 instead of y=-1.
Graph History Retained Between Runs

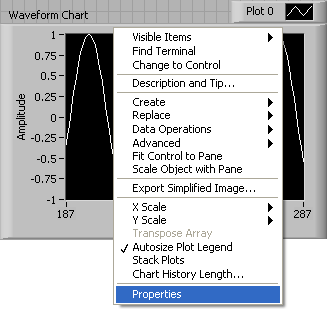
The Waveform Chart options can be easily updated by right clicking on the Waveform Chart and selecting the appropriate option to update from the pop-up menu.

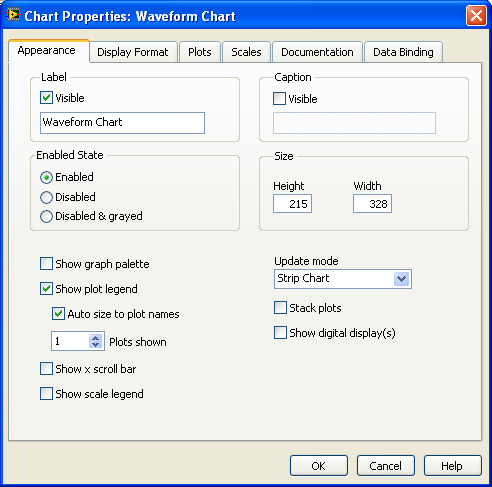
Selecting Properties from this pop-up menu brings up the Waveform Chart dialog window ( [link] ).

A waveform chart with a pop-up menu present on top of the chart. The item Properties is highlighted blue on the menu.
Waveform Chart Pop-Up Menu

A typical windows window, showing the chart properties of the waveform chart.
Waveform Chart Options Dialog Box

Waveform graph

The Waveform Graph allows numeric arrays to be displayed graphically in the Front Panel window.

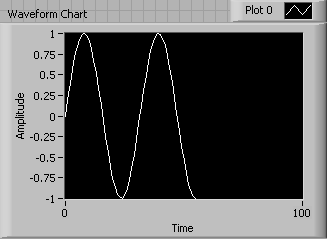
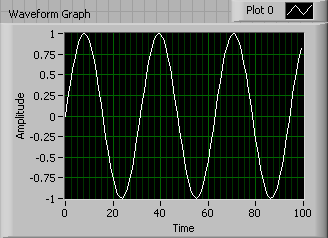
Similar to the previous example, we will build a simple G program that will allow you to graph a sine wave using the equation:

y i = sin ( 0.2 x i )

for i=0, 1, 2, … , 99.

A waveform chart with two simultaneously occurring sine waves. There are also noisy waves overlaid on top of the smoth sine waves labeled in blue and red.
Waveform Graph

Single plot

Start by building the following program shown in [link] .

An icon consisting of a blue box containing '100'connected to a big box containing a five items, a blue box containing an 'N'in the upper left of the big box, and then a row of icons from left to right an orange box containing '0.2'over another blue box containing 'i'. These icons connect via line to a triangle containing 'x'which is connected to a sine wave icon.
For Loop Sine Wave

Right click on the Front Panel window, select Waveform Graph from the Modern>>Graph pop-up menu, and drop it on the Front Panel window.

A row of icons located in the levels headers Modern, graph.
Select Waveform Graph

In the Block Diagram window you will see the Waveform Graph terminal. Wire the Sine function output to the Waveform Graph terminal through the For Loop .

An icon consisting of a blue box containing '100'connected to a big box containing a five items, a blue box containing an 'N'in the upper left of the big box, and then a row of icons from left to right an orange box containing '0.2'over another blue box containing 'i'. These icons connect via line to a triangle containing 'x'which is connected to a sine wave icon. On the right of this big box an orange line connects to a 'waveform graph' icon.
Waveform Graph Diagram

Run the program. The resulting graph is shown in [link] .

A sine wave graph with an amplitude of 1.
Sine Wave Graph

Multiplots

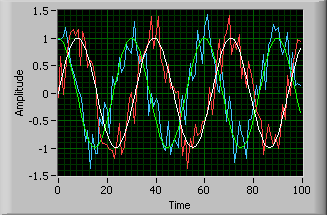
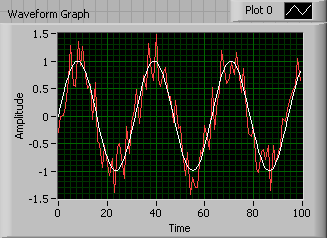
In this example a sine wave and a noisy sine wave will be plotted. Modify the previous example to add noise to the sine operation as shown in [link] .

An icon consisting of a blue box containing '100'connected to a big box containing a five items, a blue box containing an 'N' in the upper left of the big box, and then a row of icons from left to right an orange box containing '0.2'over another blue box containing 'i'. These icons connect via line to a triangle containing 'x' which is connected to a sine wave icon. Below the Sine wave icon there is an orange box containing '0.5'. Lines go from theses to icons to a final icon. between these two lines there is an icon of dice, which also points to the final icon.
Sine and Noisy Sine Waveforms

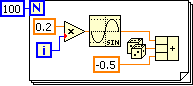
Add a Build Array operator and wire the output of the Sine function and the multi-add operator containing the sine value plus some random noise between -0.5 and 0.5 to the Build Array operator. Wire the output of the Build Array operator to the Waveform Graph terminal.

An icon consisting of a blue box containing '100'connected to a big box containing a five items, a blue box containing an 'N' in the upper left of the big box, and then a row of icons from left to right an orange box containing '0.2'over another blue box containing 'i'. These icons connect via line to a triangle containing 'x' which is connected to a sine wave icon. Below the Sine wave icon there is an orange box containing '0.5'. Lines go from theses to icons to a final icon in the big box. Between these two lines there is an icon of dice, which also points to the final icon in the big box.Two orange lines extend from the big box to another icon outside the box which connects via a line to a 'waveform graph' icon.
Bundle Arrays for Multiplotting

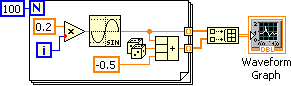
You can continue adding 1D arrays to be multiplotted into a single Waveform Graph .

Run the program. The multiplot result is shown in [link] .

A sine wave on a graph with a noisy red wave plotted on top of it.
Multiplot

Xy graph

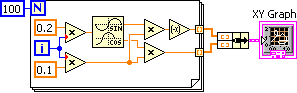
The XY Graph plots x vs. y numeric values contained in arrays.

An 'XY graph' that consist of a spiral plotted on the graph.
XY Graph

The example shown in [link] generates the spiral shown in [link] .

An array of icon labeled 'Spiral G Program'.
Spiral G Program

Get Jobilize Job Search Mobile App in your pocket Now!

Get it on Google Play Download on the App Store Now


Source:  OpenStax, Introduction to g programming. OpenStax CNX. Mar 15, 2010 Download for free at http://cnx.org/content/col11192/1.1
Google Play and the Google Play logo are trademarks of Google Inc.

Notification Switch

Would you like to follow the 'Introduction to g programming' conversation and receive update notifications?

Ask