

| << Chapter < Page | Chapter >> Page > |
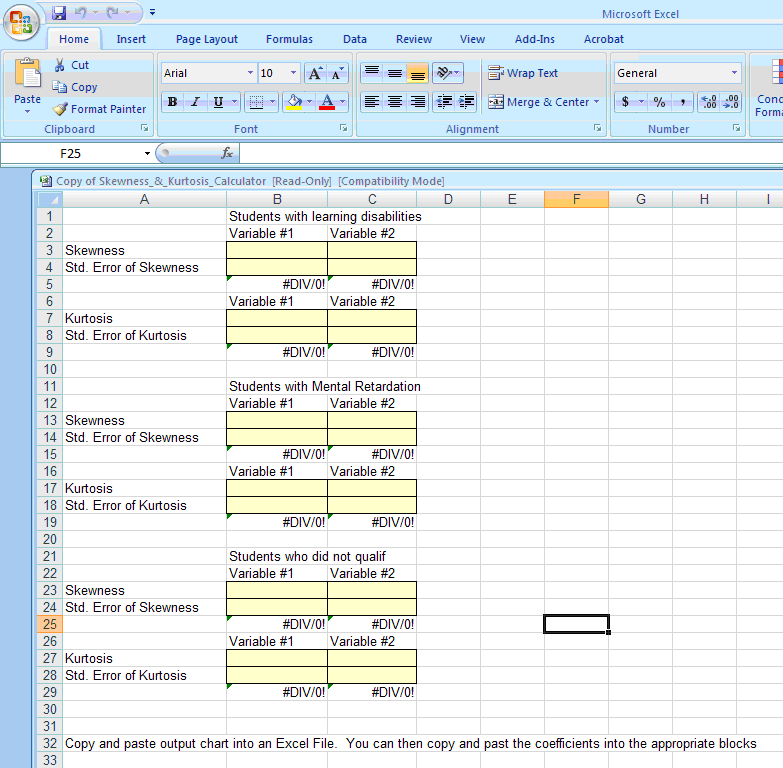
| CH005TC09R | CL005TC09R | CW005TC09R | |
| N Valid | 3125 | 1805 | 1877 |
| Missing | 5197 | 6517 | 6445 |
| Skewness | -1.129 | -.479 | -2.197 |
| Std. Error of Skewness | .044 | .058 | .056 |
| Kurtosis | 1.818 | -.42 | 6.991 |
| Std. Error of Kurtosis | .088 | .115 | .113 |
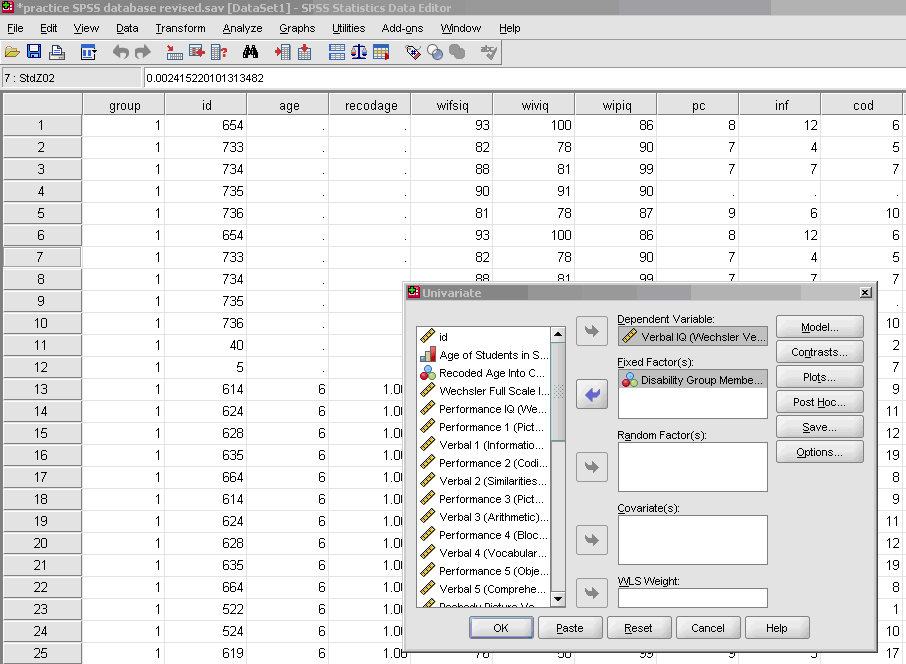
Dependent Variable: Verbal IQ (Wechsler Verbal Intelligence 3)
| Source | Type III Sum of Squares | Df | Mean Square | F | Sig. | Partial Eta Squared |
| Corrected | 101503.093 a | 2 | 50751.547 | 503.219 | .000 | .461 |
| Model | ||||||
| Intercept | 6366052.170 | 1 | 6366052.170 | 63121.595 | .000 | .982 |
| group | 101503.093 | 2 | 50751.547 | 503.219 | .000 | .461 |
| Error | 118906.620 | 1179 | 100.854 | |||
| Total | 7405615.000 | 1182 | ||||
| Corrected Total | 220409.713 | 1181 |
So, how do you "write up" your Research Questions and your Results? Schuler W. Huck (2000) in his seminal book entitled, Reading Statistics and Research, points to the importance of your audience understanding and making sense of your research in written form. Huck further states:
This book is designed to help people decipher what researchers are trying to communicate in the written or oral summaries of their investigations. Here, the goal is simply to distill meaning from the words, symbols, tables, and figures included in the research report. To be competent in this arena, one must not only be able to decipher what's presented but also to "fill in the holes"; this is the case because researchers typically assume that those receiving the research report are familiar with unmentioned details of the research process and statistical treatment of data.
Researchers and Professors John Slate and Ana Rojas-LeBouef understand this critical issue, so often neglected or not addressed by other authors and researchers. They point to the importance of doctoral students "writing up their statistics" in a way that others can understand your reporting and as importantly, interpret the meaning of your significant findings and implications for the preparation and practice of educational leadership. Slate and LeBouef provide you with a model for "writing up your parametric ANOVA statistics."
Click here to view: Writing Up Your Parametric One Way ANOVA Statistics
Notification Switch
Would you like to follow the 'Calculating basic statistical procedures in spss: a self-help and practical guide to preparing theses, dissertations, and manuscripts' conversation and receive update notifications?

|
|

|
|

|
|

|
|

|
|

|
|
|
|
|

|
|

|
|

|