<< Chapter < Page Chapter >> Page >

This module is published by NCPEA Press and is presented as an NCPEA/Connexions publication. Each chapter has been peer-reviewed, accepted, and endorsed by the National Council of Professors of Educational Administration (NCPEA) as a significant contribution to the scholarship and practice of education administration. Formatted and edited in Connexions by Theodore Creighton and Brad Bizzell, Virginia Tech and Janet Tareilo, Stephen F. Austin State University.

Writing up your nonparametric independent samples t

    About the Authors

  • John R. Slate is a Professor at Sam Houston State University where he teaches Basic and Advanced Statistics courses, as well as professional writing, to doctoral students in Educational Leadership and Counseling. His research interests lie in the use of educational databases, both state and national, to reform school practices. To date, he has chaired and/or served over 100 doctoral student dissertation committees. Recently, Dr. Slate created a website, Writing and Statistical Help to assist students and faculty with both statistical assistance and in editing/writing their dissertations/theses and manuscripts.
  • Ana Rojas-LeBouef is a Literacy Specialist at the Reading Center at Sam Houston State University where she teaches developmental reading courses. She recently completed her doctoral degree in Reading, where she conducted a 16-year analysis of Texas statewide data regarding the achievement gap. Her research interests lie in examining the inequities in achievement among ethnic groups. Dr. Rojas-LeBouef also assists students and faculty in their writing and statistical needs on the Writing and Statistical website, Writing and Statistical Help

The following is an example of how to write up (in manuscript text) your Nonparametric Independent Samples t test statistics. This module is used with a larger Collection (Book) authored by John R. Slate and Ana Rojas-LeBouef from Sam Houston State University and available at: Calculating Basic Statistical Procedures in SPSS: A Self-Help and Practical Guide to Preparing Theses, Dissertations, and Manuscripts

Gender Differences in Arithmetic Among Grade 4 Students

Research question

In this study the following research question was addressed:

  • What is the effect of gender on Arithmetic scores among Grade 4 students?

Results

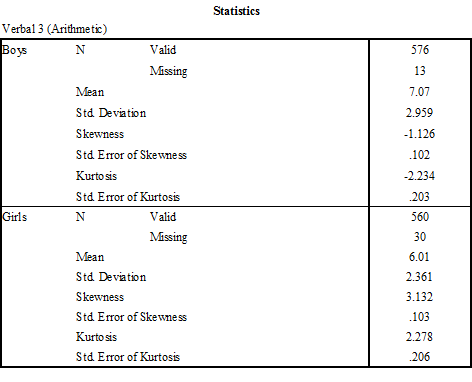
An examination of the standardized skewness coefficient (i.e., the skewness value divided by the standard error of the skewness) and standardized kurtosis coefficient (i.e., the kurtosis value divided by the standard error of the kurtosis) revealed serious departures from normality for the dependent variable, Arithmetic, for both boys and girls. Depicted in Table 1 are the four standardized coefficients, all of which were far beyond the boundaries of normality, +/- 3 (Onwuegbuzie&Daniel, 2002).

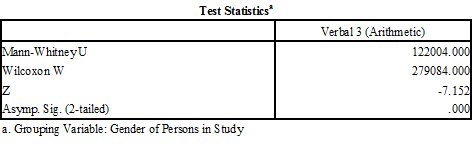
Because Arithmetic scores for boys and for girls were not normally distributed, a nonparametric (i.e., Mann-Whitney’s U ) independent samples t -test was used to compare the Arithmetic scores of boys and girls. The Mann-Whitney U test revealed a statistically significant gender difference in Arithmetic scores, U = 122004.00, p <.001. The Cohen’s d effect size associated with this difference was 0.40. Using Cohen’s (1988) criteria, this finding represented a small-to-moderate effect size. Presented in Table 2 are the descriptive statistics for Arithmetic scores for boys and for girls. Boys had statistically significantly higher Arithmetic scores than did girls.

References

  • Cohen, J. (1988). Statistical power analysis for the behavioral sciences (2nd ed.) . Hillsdale, NJ: Lawrence Erlbaum.
  • Onwuegbuzie, A. J.,&Daniel, L. G. (2002). Uses and misuses of the correlation coefficient. Research in the Schools, 9 (1) , 73-90.
To be compliant with APA 6th edition, students and faculty are to be aware that Table titles are placed "above" the table entry. Titles here are placed below the tables because of special formatting templates and for conciseness of visual presentation.
Standardized Skewness Coefficients and Standardized Kurtosis Coefficients for Arithmetic Scores by Gender
Variable Standardized Skewness Coefficient Standardized Kurtosis Coefficient
Boys -11.04 -11.00
Girls 30.41 11.06
Sample Sizes, Means, and Standard Deviations by Gender for Arithmetic Scores
Gender n M SD
Boys 576 7.07 2.96
Girls 560 6.01 2.36
Figures 1 and 2 below came directly from SPSS output. As such, they are not compliant with APA 6th edition and should not be used in theses, dissertations, or manuscripts. Only Table 1 and 2above the Output from SPSS are compliant with APA format.

Spss statistical output

Figure 1. statistics

Figure 2. test statistics

Questions & Answers

differentiate between demand and supply giving examples
Lambiv Reply
differentiated between demand and supply using examples
Lambiv
what is labour ?
Lambiv
how will I do?
Venny Reply
how is the graph works?I don't fully understand
Rezat Reply
information
Eliyee
devaluation
Eliyee
t
WARKISA
hi guys good evening to all
Lambiv
multiple choice question
Aster Reply
appreciation
Eliyee
explain perfect market
Lindiwe Reply
In economics, a perfect market refers to a theoretical construct where all participants have perfect information, goods are homogenous, there are no barriers to entry or exit, and prices are determined solely by supply and demand. It's an idealized model used for analysis,
Ezea
What is ceteris paribus?
Shukri Reply
other things being equal
AI-Robot
When MP₁ becomes negative, TP start to decline. Extuples Suppose that the short-run production function of certain cut-flower firm is given by: Q=4KL-0.6K2 - 0.112 • Where is quantity of cut flower produced, I is labour input and K is fixed capital input (K-5). Determine the average product of lab
Kelo
Extuples Suppose that the short-run production function of certain cut-flower firm is given by: Q=4KL-0.6K2 - 0.112 • Where is quantity of cut flower produced, I is labour input and K is fixed capital input (K-5). Determine the average product of labour (APL) and marginal product of labour (MPL)
Kelo
yes,thank you
Shukri
Can I ask you other question?
Shukri
what is monopoly mean?
Habtamu Reply
What is different between quantity demand and demand?
Shukri Reply
Quantity demanded refers to the specific amount of a good or service that consumers are willing and able to purchase at a give price and within a specific time period. Demand, on the other hand, is a broader concept that encompasses the entire relationship between price and quantity demanded
Ezea
ok
Shukri
how do you save a country economic situation when it's falling apart
Lilia Reply
what is the difference between economic growth and development
Fiker Reply
Economic growth as an increase in the production and consumption of goods and services within an economy.but Economic development as a broader concept that encompasses not only economic growth but also social & human well being.
Shukri
production function means
Jabir
What do you think is more important to focus on when considering inequality ?
Abdisa Reply
any question about economics?
Awais Reply
sir...I just want to ask one question... Define the term contract curve? if you are free please help me to find this answer 🙏
Asui
it is a curve that we get after connecting the pareto optimal combinations of two consumers after their mutually beneficial trade offs
Awais
thank you so much 👍 sir
Asui
In economics, the contract curve refers to the set of points in an Edgeworth box diagram where both parties involved in a trade cannot be made better off without making one of them worse off. It represents the Pareto efficient allocations of goods between two individuals or entities, where neither p
Cornelius
In economics, the contract curve refers to the set of points in an Edgeworth box diagram where both parties involved in a trade cannot be made better off without making one of them worse off. It represents the Pareto efficient allocations of goods between two individuals or entities,
Cornelius
Suppose a consumer consuming two commodities X and Y has The following utility function u=X0.4 Y0.6. If the price of the X and Y are 2 and 3 respectively and income Constraint is birr 50. A,Calculate quantities of x and y which maximize utility. B,Calculate value of Lagrange multiplier. C,Calculate quantities of X and Y consumed with a given price. D,alculate optimum level of output .
Feyisa Reply
Answer
Feyisa
c
Jabir
the market for lemon has 10 potential consumers, each having an individual demand curve p=101-10Qi, where p is price in dollar's per cup and Qi is the number of cups demanded per week by the i th consumer.Find the market demand curve using algebra. Draw an individual demand curve and the market dema
Gsbwnw Reply
suppose the production function is given by ( L, K)=L¼K¾.assuming capital is fixed find APL and MPL. consider the following short run production function:Q=6L²-0.4L³ a) find the value of L that maximizes output b)find the value of L that maximizes marginal product
Abdureman
types of unemployment
Yomi Reply
What is the difference between perfect competition and monopolistic competition?
Mohammed
Got questions? Join the online conversation and get instant answers!
Jobilize.com Reply

Get Jobilize Job Search Mobile App in your pocket Now!

Get it on Google Play Download on the App Store Now


Source:  OpenStax, Presenting and communicating your statistical findings: model writeups. OpenStax CNX. Apr 27, 2011 Download for free at http://cnx.org/content/col11299/1.3
Google Play and the Google Play logo are trademarks of Google Inc.

Notification Switch

Would you like to follow the 'Presenting and communicating your statistical findings: model writeups' conversation and receive update notifications?

Ask