<< Chapter < Page Chapter >> Page >

The section Derivation of the equations for a Basic FDM-TDM Transmux showed the FDM-TDM transmultiplexer can be viewed as an efficient implementation of a bank of digital tuners, and that the data-weighting function h ( k ) is just the pulse response of the FIR lowpass filter used in these equivalent tuners. We therefore approach the design of h ( k ) by designing the proper tuner pulse response.

The perfect filter pulse response would pass the signal of interest with no gain or phase distortion, would completely suppress all other FDM channels, and would require little computation. These are not all simultaneously achievable, of course, and the design of the actual filter is a compromise between these issues. It is further complicated by the fact that software packages are not generally available to perform some of the types of optimization needed to design these filters. We proceed first by examining how an optimal equal-ripple linear phase FIR filter performs.

Use of optimal, linear phase, equal-ripple design techniques

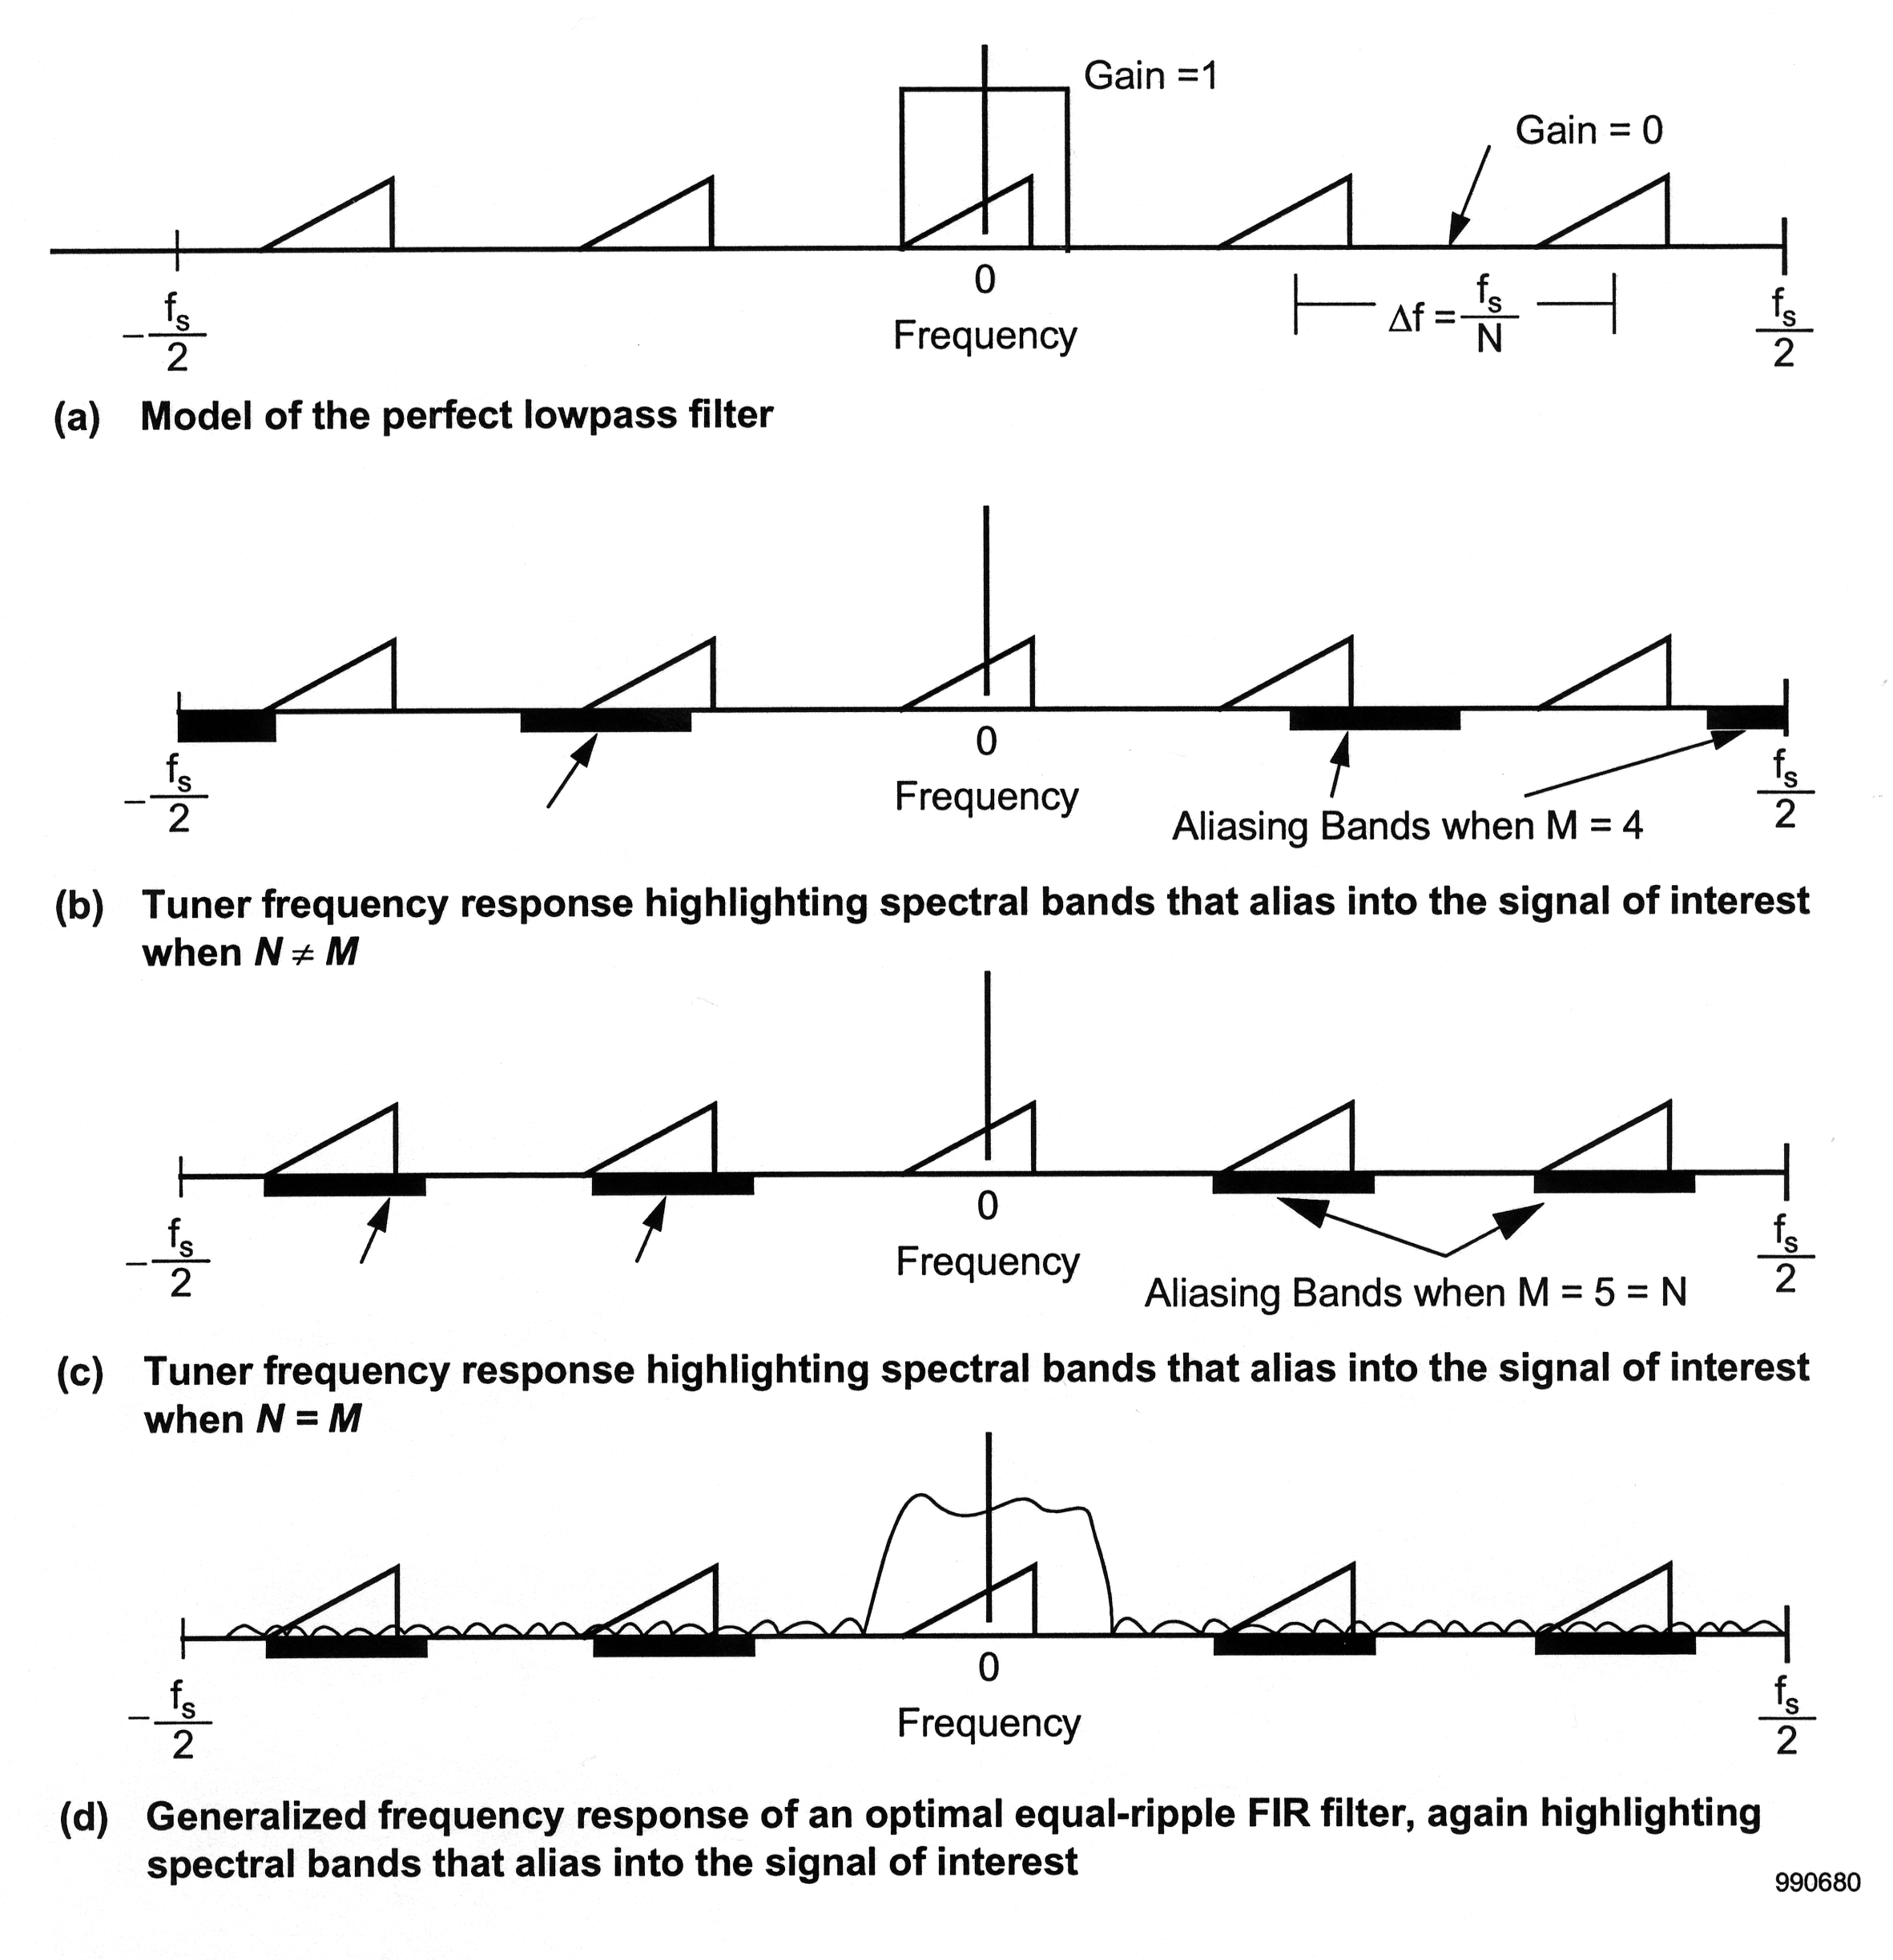
The filter design problem at hand can be understood by examining [link] . The perfect filter, shown in [link] (a), passes the channel of interest with unity gain and zero phase shift across its bandwidth of B Hz, centered at DC, and completely attenuates energy at all other frequencies between - f s 2 and f s 2 .

In fact, it is not necessary to suppress all out-of-band energy to protect the signal of interest. The principal reason for this filtering is to suppress the out-of-band components that alias into the band of interest when the output of the tuner (that is, transmultiplexer) is decimated by the factor M . These bands are shown in [link] (b) for the general case in which M N , while [link] (c) shows the important special case of the basic FDM-TDM transmux in which N = M . In the latter case, the FDM channels not of interest alias directly onto the signal of interest while, in the former, the channels not of interest may be spread around the band more.

As alluded to earlier, practical FIR filters of finite duration cannot pass the signal interest perfectly and suppress all other energy completely. The response shown in [link] (d) is the generalized response of a good practical approximation, the response provided by an optimal FIR linear-phase, equal-ripple filter of the sort designed by the Parks-McClellan software package. These filters provide flat differential group delay and allow the designer to optimally trade between passband ripple, stopband suppression, and transition band as a function of the filter order L . A description of this general filter design methodology can be found in [link] .

This figure contains four separate graphs arranged vertically. The upper graph is labeled (a) Model of the perfect lowpass filter. It consist of a long horizontal line labeled Frequency with the extremes labeled -f_s/2 on the left and f_s/2 on the right. The middle is labeled 0. There are five right triangles on this line. The middle right triangle is situated directly in the middle with a vertical line rising through its center and the triangle is contained with in three line forming a box around it. To right of the upper right corner is the phrase Gain=1. There are two right triangles on either side of the center triangle. Below the right two there is a line measuring the width between the center points of the two triangles. In the middle of this line is the phrase delta f= f_s/N. In between the two triangles is an arrow pointing to the long horizontal line indicating the space as Gain=0. The second image is labeled (b) Tuner frequency response highlighting spectral bands that alias into the signal of interest when N≠M. This graph consist of a long horizontal line labeled frequency with the extremes labeled on the left -f_s/2 and f_s/2 on the right. The middle is marked 0. On top of this line are five right triangles at equal distances from each other. Underneath the line there are four black rectangles. These black triangles roughly correspond to the triangle above the line. The middle triangle does not have a black rectangle under it, but a vertical line rise from the center of this triangle. An arrow points to both the right two rectangles labeleing them Aliasing Bands when M=4. There is another arrow pointing to the middle left rectangle, but there is no label. The third graph is very similar to the previous graph and it is labeled (c) Tuner frequency response highlighting spectral bands that alias into the signal of interest when N=M. It is exactly the same except the label for the two right black rectangles is now Aliasing Bands when M=5=N, and there are arrows pointing to both of the left black rectangles, but they still do not have have labels. Also the black triangles correspond better to the triangles in this graph. The fourth graph is very similar to the previous graph, and it is labeled (d) Generalized frequency response of an optimal equal-ripple FIR filter, again highlighting spectral bands that alias into the signal of interest. Just like the previous graphs there are five right triangls  and four corresponding black rectangles. A horizontal line labeled Frequency spans the bottom of the graph with extremes labeled -f_s/2 on the left and f_s/2 on the right while the middle is labeled 0. A vertical black line exist in the middle of the of the center triangle. With this graph as waveform begins on the far left side of the graph and wavers across the horizontal line until it nearly reaches the middle triangle. At this point it takes on an almost vertical slope and then wavers over the center triangle and then falls at an equally vertical slope on the right side of the center triangle. The wave form continues across the horizontal line until the graphs ends on the right.
Frequency Responses of Perfect and Realizable Tuner Filters

Superimposing [link] (c) with the optimal response shown in Figure 1 of [link] to produce [link] shows that we must specify the channel bandwidth B , the transition bandwidth δ f , the input sampling rate f s , the degree of passband ripple tolerable, denoted PBR and the minimum tolerable stopband attenuation in dB, denoted SBR . A multi-term empirical formula can be found in [link] which determines the filter L quite accurately for a given set of design parameters. Reference [link] simplifies the Rabiner and Gold formula considerably to produce the design equation

Get Jobilize Job Search Mobile App in your pocket Now!

Get it on Google Play Download on the App Store Now


Source:  OpenStax, An introduction to the fdm-tdm digital transmultiplexer. OpenStax CNX. Nov 16, 2010 Download for free at http://cnx.org/content/col11165/1.2
Google Play and the Google Play logo are trademarks of Google Inc.

Notification Switch

Would you like to follow the 'An introduction to the fdm-tdm digital transmultiplexer' conversation and receive update notifications?

Ask