

| << Chapter < Page | Chapter >> Page > |
With
,
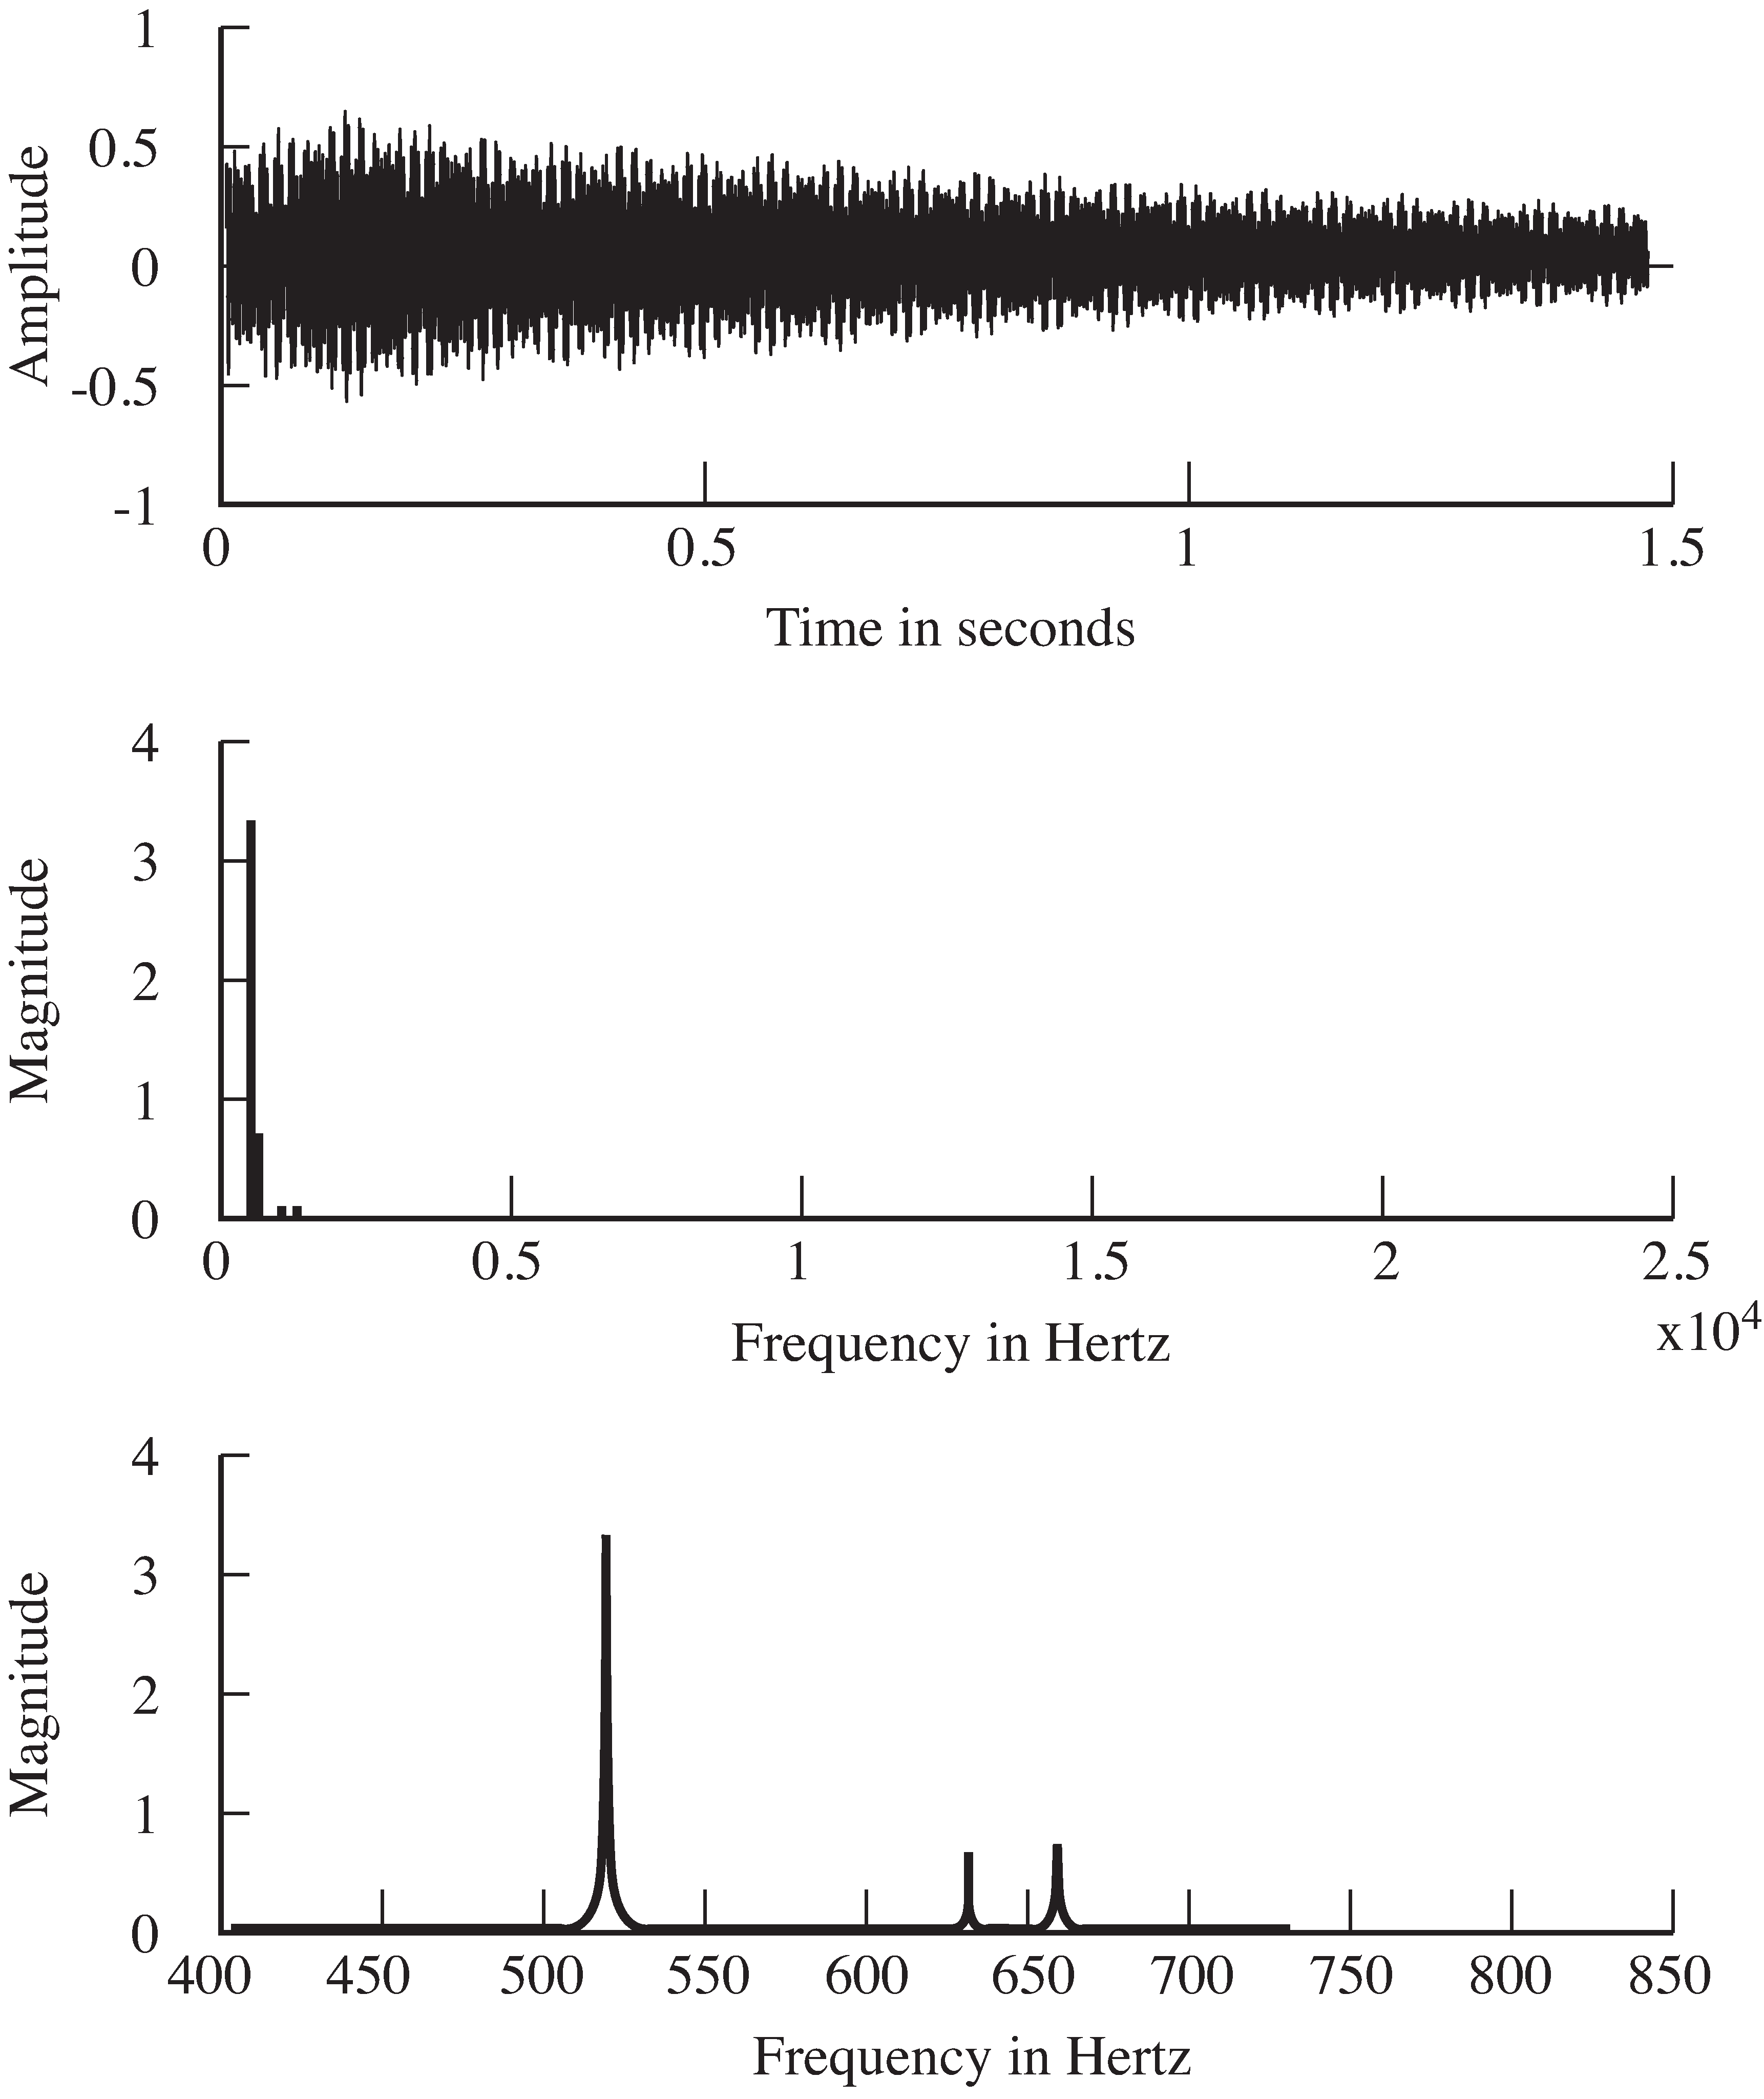
specgong.m analyzes approximately 1.5 seconds
(
Ts*N seconds, to be precise). It is reasonable to suppose
that the gong might undergo important transients duringthe first few milliseconds. This can be investigated by
decreasing
N and applying the DFT to different segments of the
data record.
Determine the spectrum of the gong sound during
the first 0.1 seconds. What value of
N is needed?
Compare this to the spectrum of a 0.1 second segmentchosen from the middle of the sound.
How do they differ?
A common practice when taking FFTs is to plot the magnitude
on a log scale. This can be done in M
atlab by replacing
the
plot command with
semilogy . Try it in
specgong.m . What extra details can you see?
The waveform of another, much larger gong is
given in
gong2.wav on the website.
Conduct a thorough analysis of this sound,looking at the spectrum for a variety of analysis windows (values
of
N ) and at a variety of times within the waveform.
Choose a .wav file from the website (in the Sounds folder) or
download a
.wav file of a song from
the Internet. Conduct a FFT analysis of the first fewseconds of sound, and then another analysis in the middle
of the song. How do the two compare?Can you correlate the
FFT analysis with the pitch of the material?With the rhythm?
With the sound quality?
The key factors in a DFT or FFT based frequency analysis are as follows:
For instance, in the analysis of the gong conducted in
specgong.m , the sampling interval
is defined by
the recording. With
, the total time is
seconds, and the frequency resolution is
Hz.
Sometimes the total absolute time is fixed. Sampling faster decreases and increases , but cannot give better resolution in frequency.Sometimes it is possible to increase the total time. Assuming a fixed , this implies an increase in and better frequency resolution. Assuming a fixed , this implies an increase in and worse resolution in time. Thus, better resolution in frequency means worse resolution intime. Conversely, better resolution in time means worse resolution in frequency.
The DFT is a key tool in analyzing and understanding the behavior of communications systems. Whenever data flows through a system,it is a good idea to plot it as a function of time, and also to plot it as a function of frequency; that is, to look atit in the time domain and in the frequency domain. Often, aspects of the data that are clearer in time are hardto see in frequency, and aspects that are obvious in frequency are obscure in time. Using both points of view is common sense.
Notification Switch
Would you like to follow the 'Software receiver design' conversation and receive update notifications?

|
|

|
|

|
|

|
|

|
|

|
|

|
|

|
|

|
|

|