<< Chapter < Page Chapter >> Page >

Focus detection

Focus Detection:

One important aspect of images is focus. While qualitatively deciding whether an image is in focus or not is relatively easy, quantitatively it can be quite difficult. One way to detect whether or not an image is in focus is by examining its power spectrum.

Power spectrum and focus

It is generally assumed that natural images are made up of fractals, and it can be shown that the power spectrum (power as a function of frequency) of a natural image should fall off as

1 f 2 size 12{ { {1} over {f rSup { size 8{2} } } } } {}

where f is the frequency.

As an image goes out of focus, it becomes blurred. That is to say that the edges are less sharp. If an image contains less sharp edges, its power spectrum will contain less high-frequency power. The power spectrum of an out-of-focus image should, therefore, fall off faster than an in-focus image.

So by calculating the power spectrum and examining its linear regression on a loglog plot (log[power] vs log[frequency]), we can get an indicator of focus.

Calculating the power spectrum

The power specturm is simply the square of the two dimensional Fourier transform:

P k x , k y = F k x , k y 2 size 12{P left (k rSub { size 8{x} } ,k rSub { size 8{y} } right )= lline F left (k rSub { size 8{x} } ,k rSub { size 8{y} } right ) rSup { size 8{2} } rline } {}

where the two dimensional Fourier transform is given by:

F k x , k y = x = 0 N 1 y = 0 N 1 f k x , k y 2 e j2π N xk x + yk y size 12{F left (k rSub { size 8{x} } ,k rSub { size 8{y} } right )= Sum cSub { size 8{x=0} } cSup { size 8{N - 1} } { Sum cSub { size 8{y=0} } cSup { size 8{N - 1} } {f left (k rSub { size 8{x} } ,k rSub { size 8{y} } right ) rSup { size 8{2} } } } e rSup { size 8{ { { - j2π} over {N} } left ( ital "xk" rSub { size 6{x} } + ital "yk" rSub { size 6{y} } right )} } } {}

Note that denotes an individual image pixel. You may have noticed that the above equations define a square image. While a non-symmetric two dimensional Fourier transform exists, using square images eases the process.

Because whether or not an image is in focus depends on the magnitude of power as a function of frequency, once the two dimensional power spectrum is computed as above, we radially average the spectrum. That is, the average of the values which lie on a circle a distance R from the origin is taken. Because frequency increases linearly in all directions from the origin, radially averaging the power spectrum gives the average power at one frequency , effectively collapsing the two dimensional spectrum to one dimension. It should be noted that F k x , k y size 12{F left (k rSub { size 8{x} } ,k rSub { size 8{y} } right )} {} has been centered around baseband, meaning the frequency of the rotionally averaged power spectrum extends from 0 to N/2 -1.

The power spectrum’s falloff on a loglog plot can now be examined to determine focus.

Illustrative example of focus analysis on entire image

The following images show the results of a linear regression of the power spectrum on a loglog plot for an in-focus image and an out-of-focus image.

Focus analysis of an in-focus image

Focus analysis of an out-of-focus image

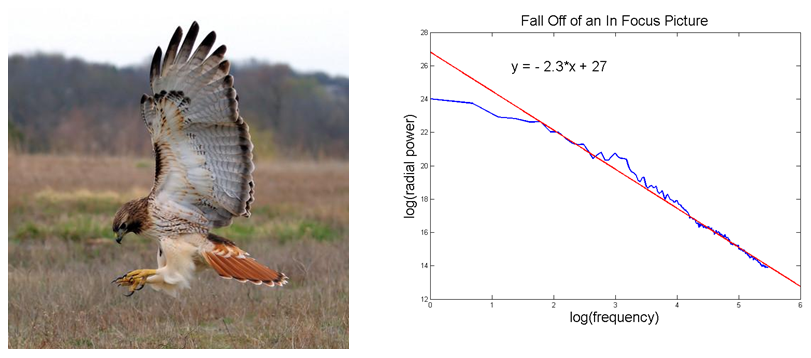
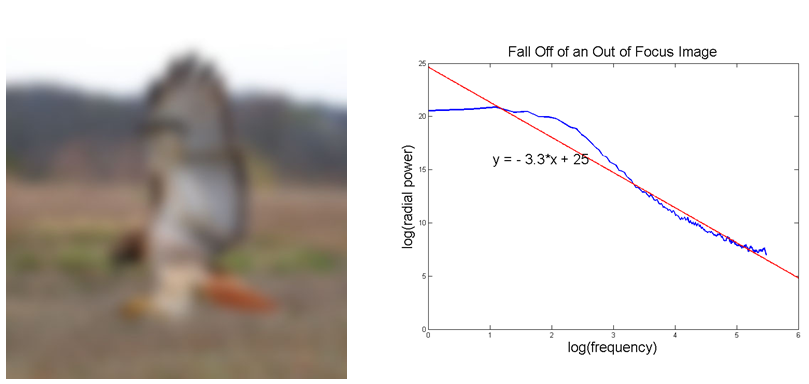
As expected, the out-of-focus image yielded a linear regression with a slope of -3.3, while the in-focus image yielded a linear regression with a slope of -2.3, indicating that the out-of-focus image has fewer high frequency components.

Determining regions of focus

Because frequency and power should be related exponentially as stated before, the loglog plot should display a linear relationship. Taking the linear regression of the loglog plot leads to an estimate of the frequency fall off. For example, if the linear regression where to return a slope of -2, we know that the power spectrum falls off as 1 f 2 size 12{ { {1} over {f rSup { size 8{2} } } } } {} .

The same principles used to determine whether or not an image is in focus can be used to determine what region of an image is in focus. Because cameras can only focus on one spatial plane, in a single picture certain objects will be more in focus than others. To determine which region of an image is in focus, one simply has to divide the image into separate spatial region and then use the methods described above on each region. The region whose power spectrum conforms most closely to the 1 f 2 size 12{ { {1} over {f rSup { size 8{2} } } } } {} fall off can be considered the center of focus in the image.

Questions & Answers

what is biology
Hajah Reply
the study of living organisms and their interactions with one another and their environments
AI-Robot
what is biology
Victoria Reply
HOW CAN MAN ORGAN FUNCTION
Alfred Reply
the diagram of the digestive system
Assiatu Reply
allimentary cannel
Ogenrwot
How does twins formed
William Reply
They formed in two ways first when one sperm and one egg are splited by mitosis or two sperm and two eggs join together
Oluwatobi
what is genetics
Josephine Reply
Genetics is the study of heredity
Misack
how does twins formed?
Misack
What is manual
Hassan Reply
discuss biological phenomenon and provide pieces of evidence to show that it was responsible for the formation of eukaryotic organelles
Joseph Reply
what is biology
Yousuf Reply
the study of living organisms and their interactions with one another and their environment.
Wine
discuss the biological phenomenon and provide pieces of evidence to show that it was responsible for the formation of eukaryotic organelles in an essay form
Joseph Reply
what is the blood cells
Shaker Reply
list any five characteristics of the blood cells
Shaker
lack electricity and its more savely than electronic microscope because its naturally by using of light
Abdullahi Reply
advantage of electronic microscope is easily and clearly while disadvantage is dangerous because its electronic. advantage of light microscope is savely and naturally by sun while disadvantage is not easily,means its not sharp and not clear
Abdullahi
cell theory state that every organisms composed of one or more cell,cell is the basic unit of life
Abdullahi
is like gone fail us
DENG
cells is the basic structure and functions of all living things
Ramadan
What is classification
ISCONT Reply
is organisms that are similar into groups called tara
Yamosa
in what situation (s) would be the use of a scanning electron microscope be ideal and why?
Kenna Reply
A scanning electron microscope (SEM) is ideal for situations requiring high-resolution imaging of surfaces. It is commonly used in materials science, biology, and geology to examine the topography and composition of samples at a nanoscale level. SEM is particularly useful for studying fine details,
Hilary
cell is the building block of life.
Condoleezza Reply
Got questions? Join the online conversation and get instant answers!
Jobilize.com Reply

Get Jobilize Job Search Mobile App in your pocket Now!

Get it on Google Play Download on the App Store Now


Source:  OpenStax, Adaptive region of interest for video. OpenStax CNX. Dec 14, 2010 Download for free at http://cnx.org/content/col11256/1.1
Google Play and the Google Play logo are trademarks of Google Inc.

Notification Switch

Would you like to follow the 'Adaptive region of interest for video' conversation and receive update notifications?

Ask