

| << Chapter < Page | Chapter >> Page > |

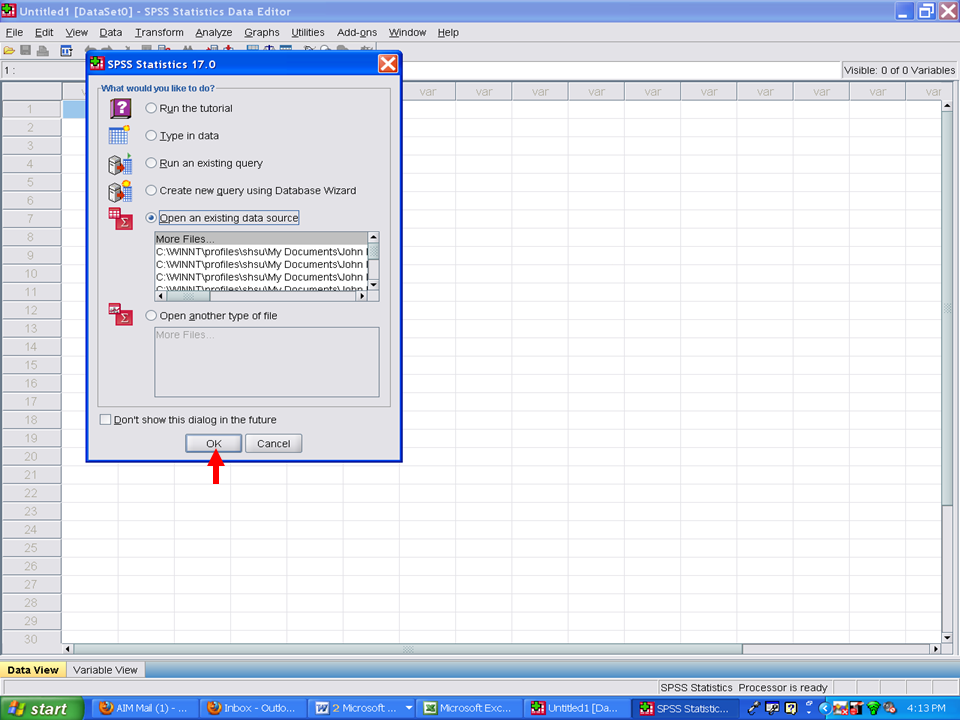
These procedures are to be followed when you have data already entered into an Excel file. In this chapter, you will be provided with steps and screenshots on how to convert the data from an Excel file into an SPSS data file. Open up your SPSS program and this screen will appear. Click on Cancel.
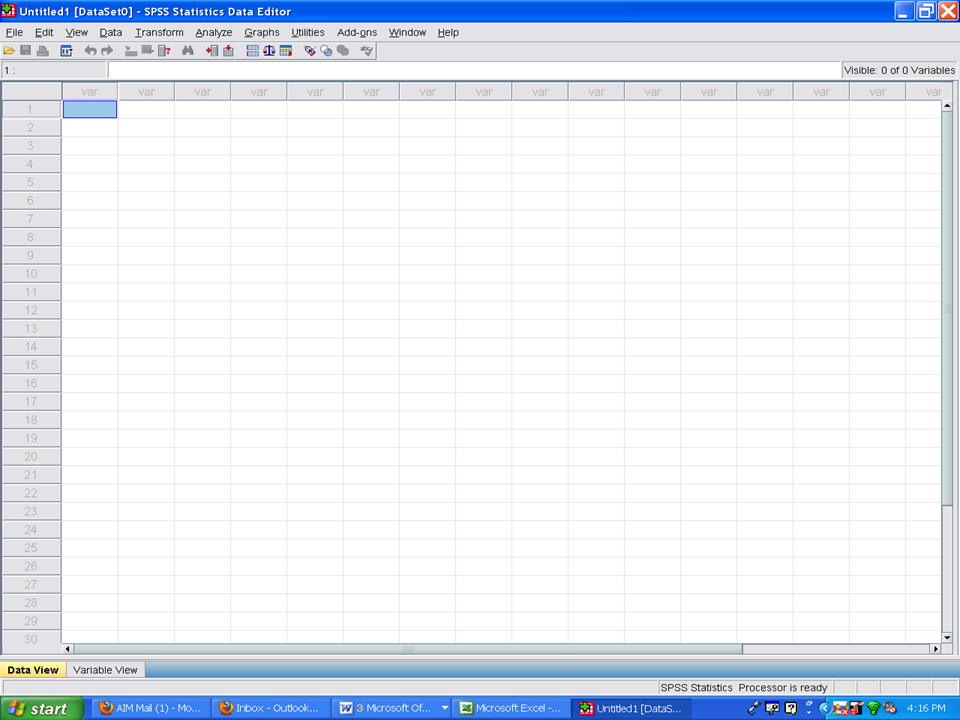
Your screen will now look like this.
The Excel file we will be converting for this example looks like the following:
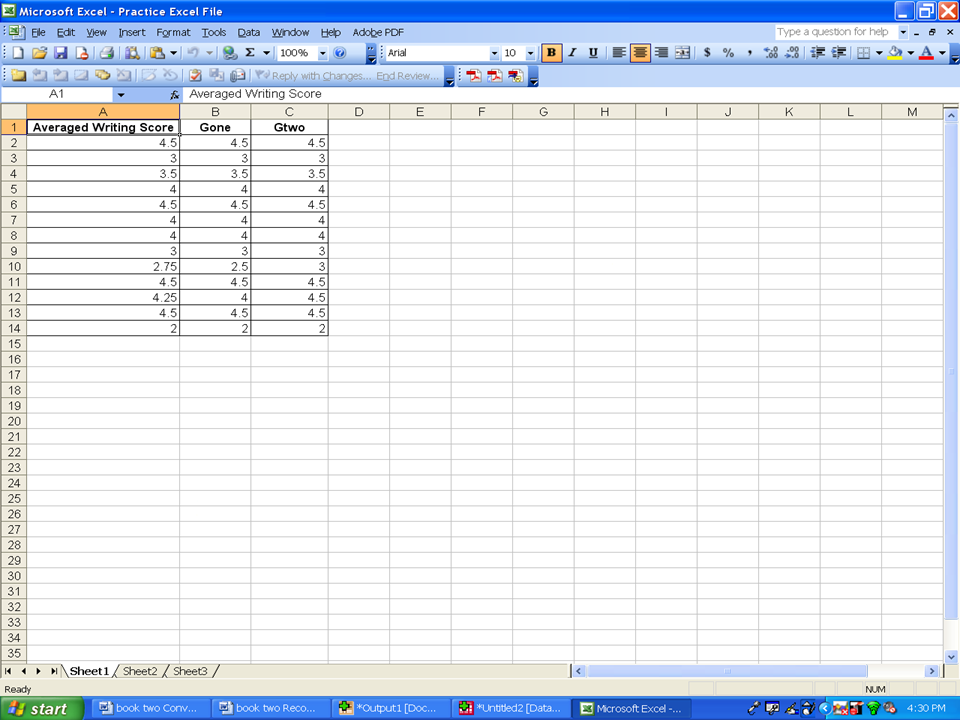
In this excel file are three variables: AveragedWritingScore, Gone, and Gtwo. All three are numeric variables. The first row contains the variable names. Rows 2 through 14 contain the data for the variables.
Prior to the next steps, make sure that the Excel file that you intend to convert into SPSS is not open. If it is open and in use, SPSS will not be able to convert the file.
Once you are back in the SPSS data view window,
√ Click on File
√ Click on Open
√ Click on Data

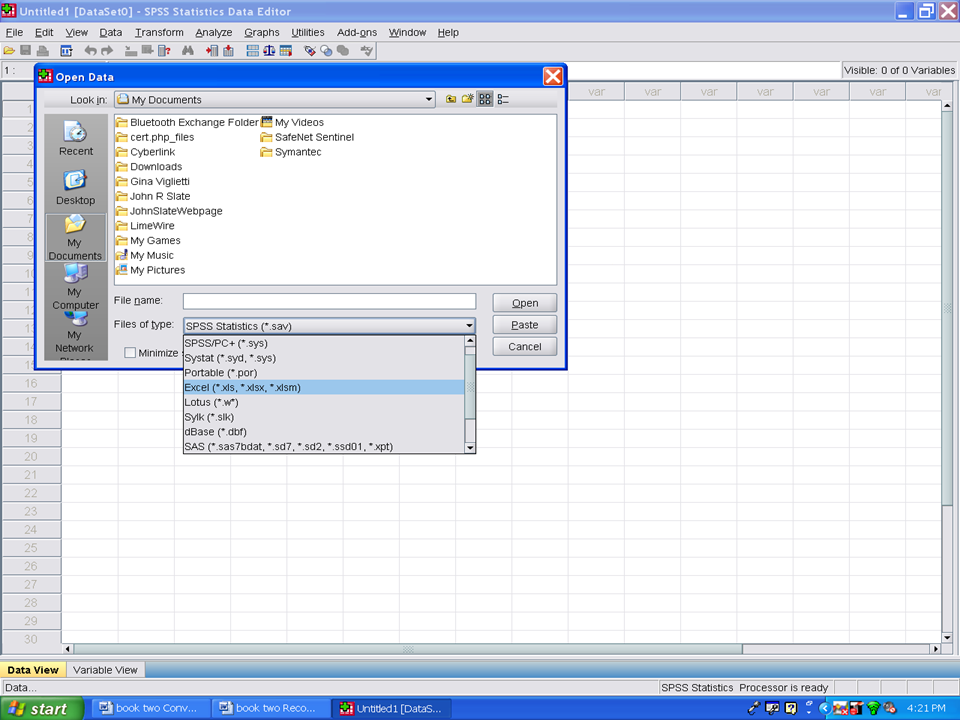
A screen similar to the one below will open up on your computer. You need to locate where your Excel file is located. First, you will need to change the Files of type below.
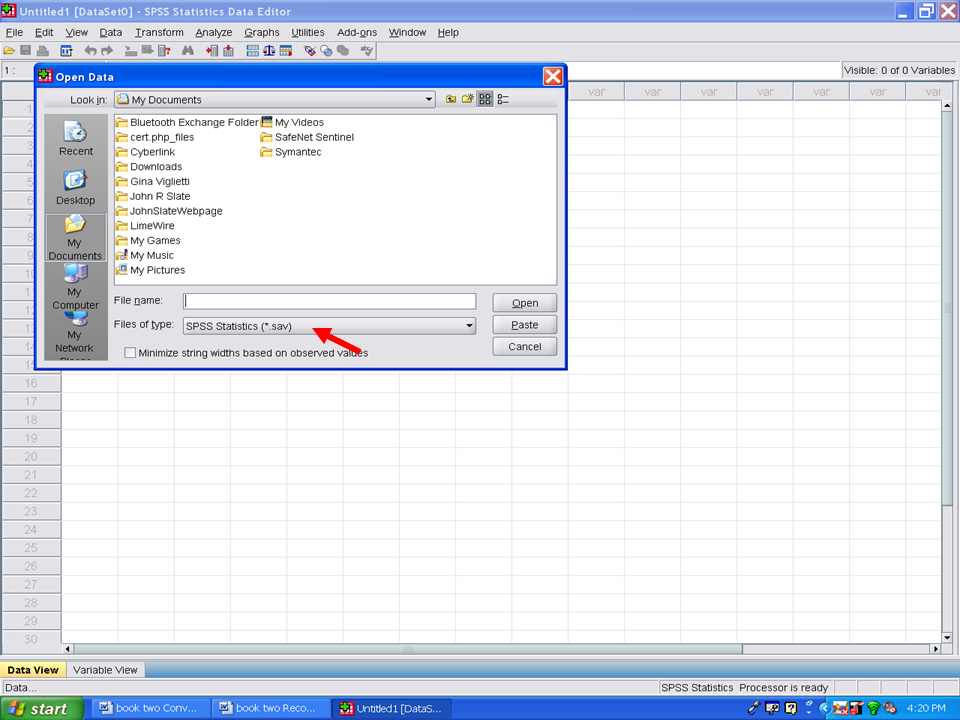
Change from SPSS statistics (*.sav) to Excel (*.xls). Then find where the file is located and its name.
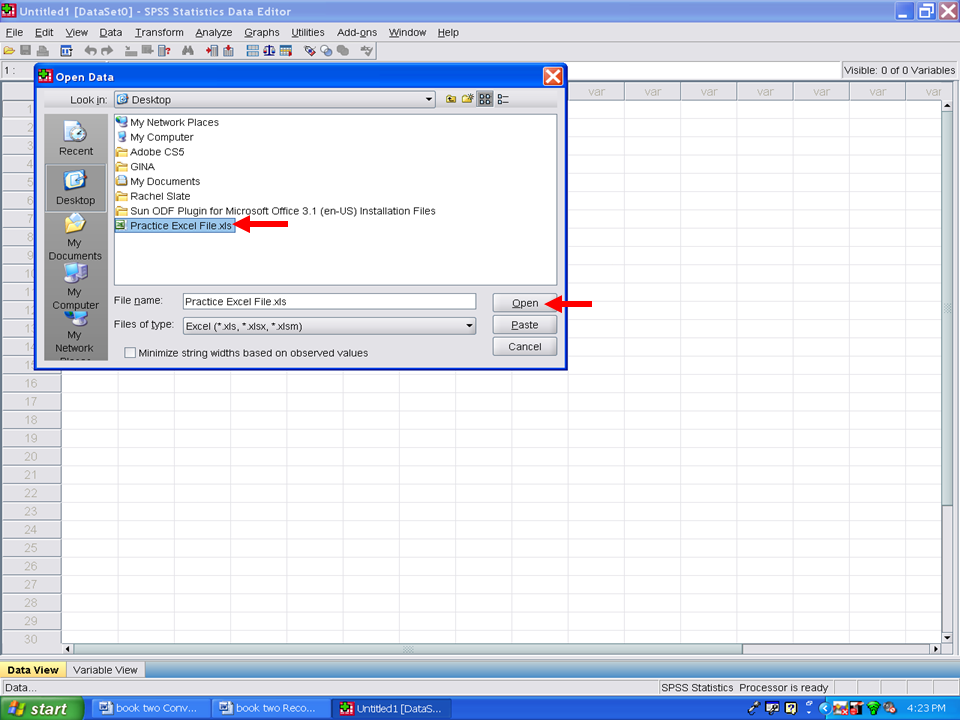
In the case of this example, the Excel file was located on the Desktop and is titled, Practice Excel File.xls. Then click on Open.
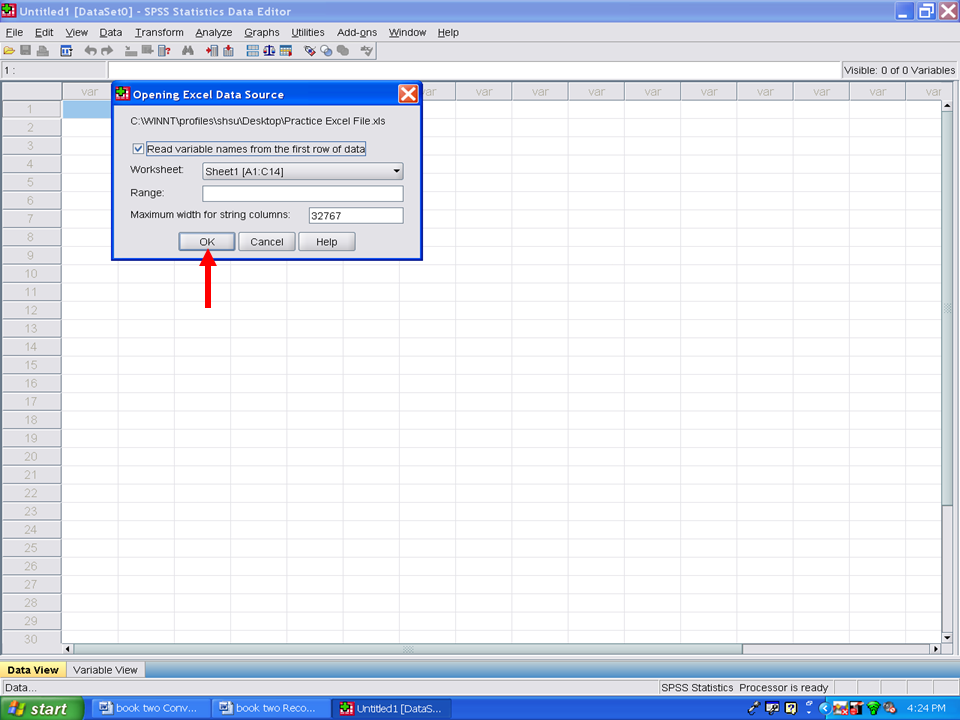
After clicking on open, the screen below will appear. For an Excel file to be converted properly into SPSS, the first row in the Excel file should be the names of the variables. All of the other rows in the Excel file should be the data. If you use more than one row to describe your variables, you will not be able to convert your Excel file into SPSS using these steps.
Once this screen has appeared, click on OK.
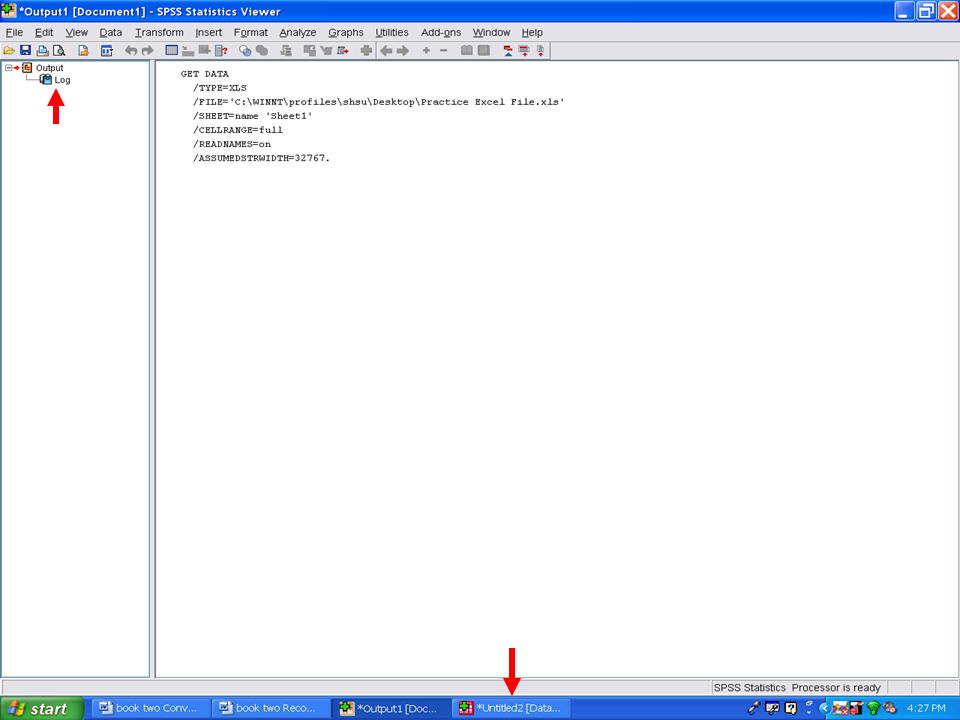
You should then be sent to the Output window.
Click on the SPSS data button below to get back to your SPSS screen.
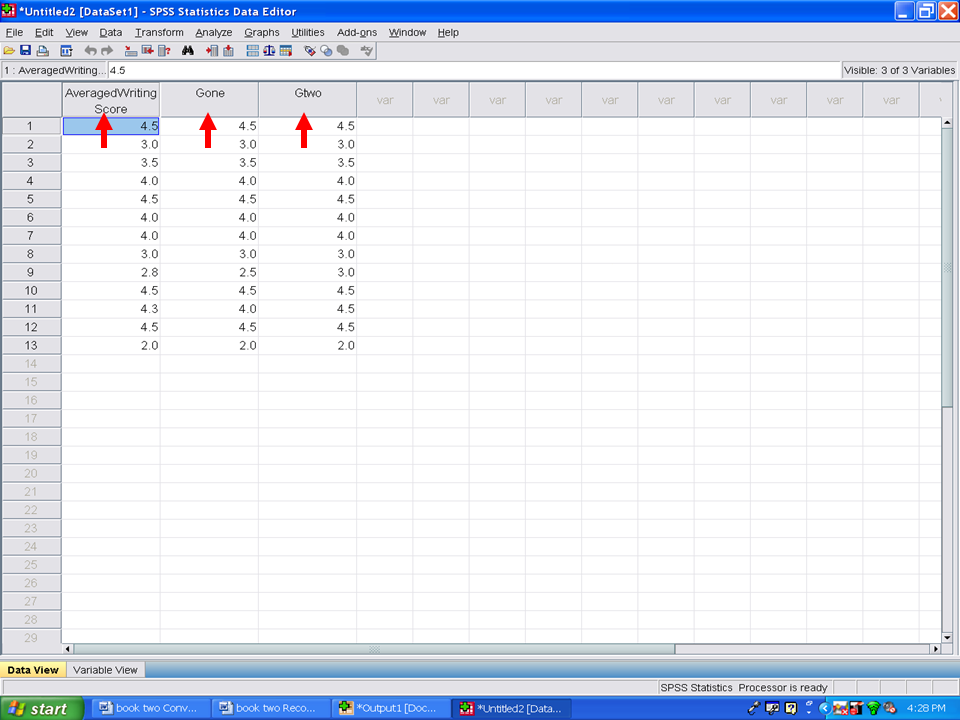
Clicking on the SPSS data icon as depicted above should take you to the Data View screen. In this case, three variables were in the Excel data file: AveragedWritingScore, Gone, and Gtwo. These three variables were directly converted from the Excel file into a SPSS datafile.
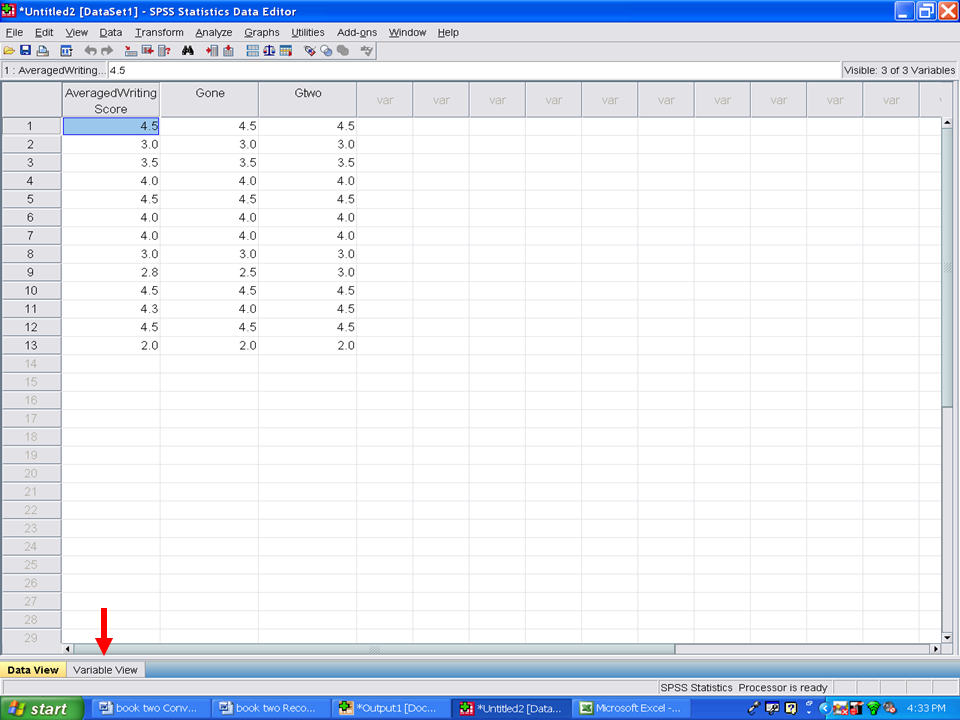
Now we need to make sure that the variables are correctly identified and labeled in this SPSS dataset. Click on Variable View.
In the case of our example, the screen looks like the following:
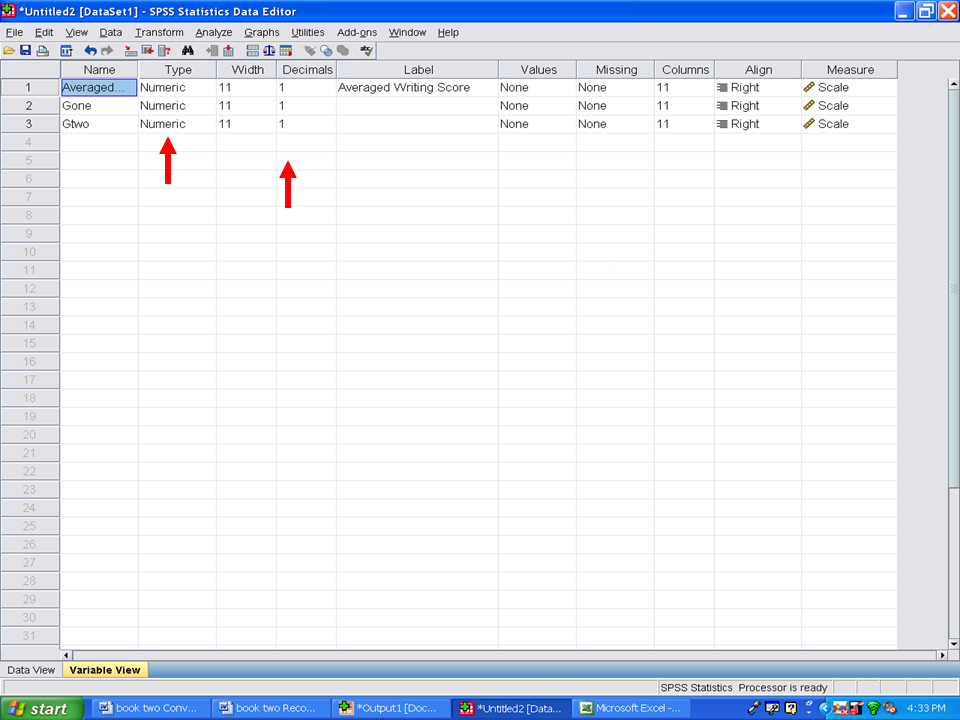
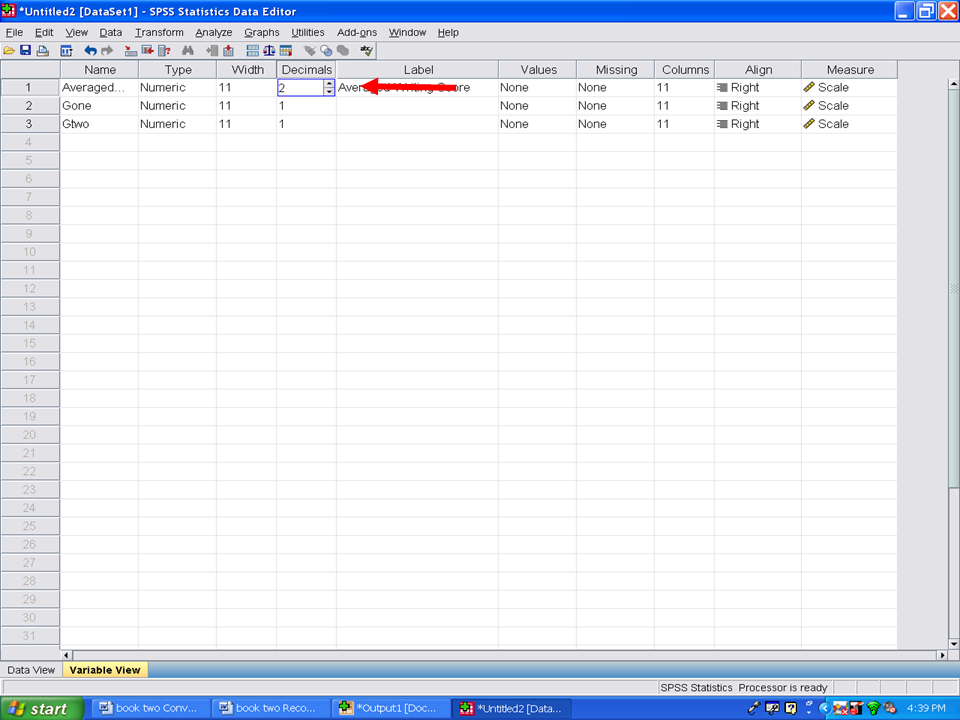
All three of the variables have been correctly identified as numeric. The number of decimals needs to be increased to 2, not 1 as shown above.
To change the number of decimal places from 1 to 2, click on one of the decimal cells. In the screen below, the decimal cell for the first row has been clicked on. Once clicked an up and a down arrow will appear.
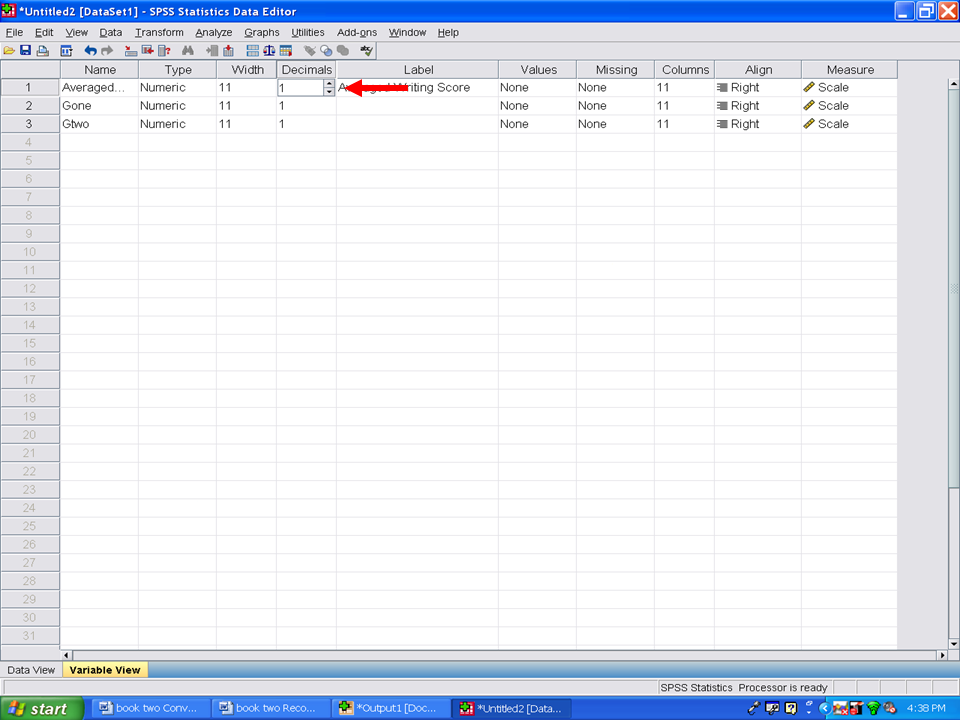
We need to increase the number of decimal places so we will click on the up arrow.
Clicking one time on the up arrow will change the number of decimals from 1 to 2.
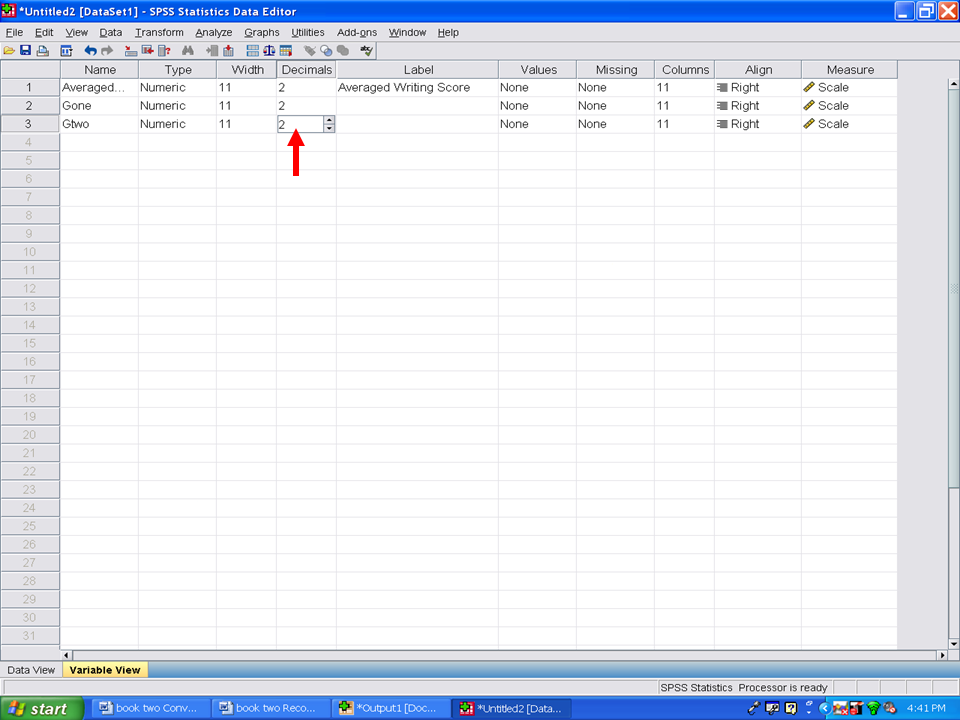
Now we will do the same for row 2 and for row 3.
Viewing the screen below will show you that all three variables now have 2 decimal places.
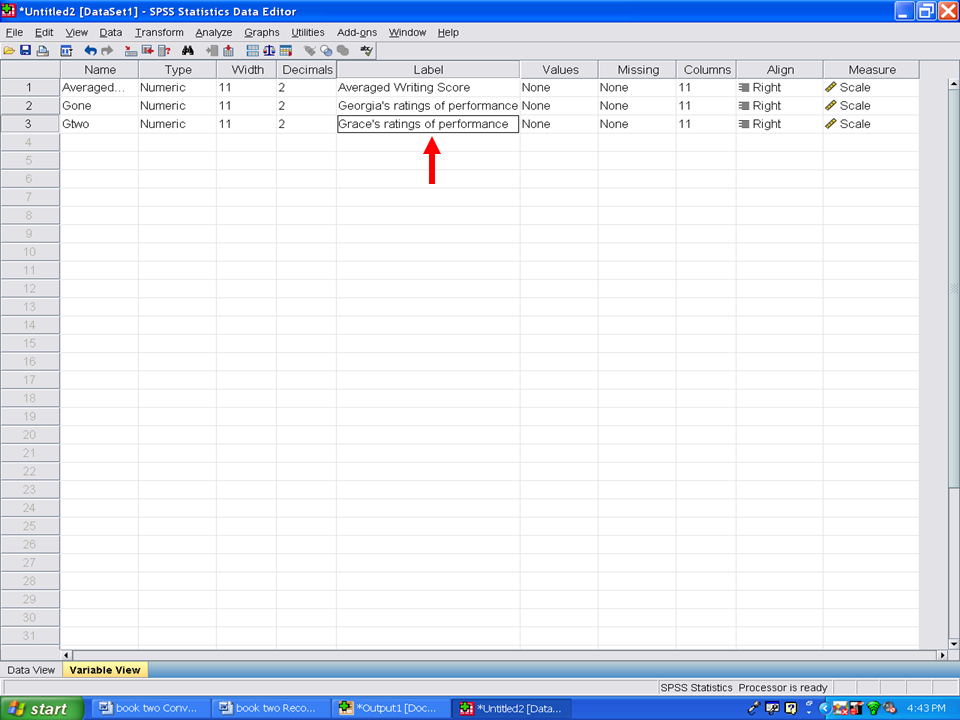
Prior to conducting any statistical analyses, we recommend that you type in identifying information in the Label column for each variable. The information you type in the Label column will be the information printed out in the SPSS output and will make it easier to interpret.
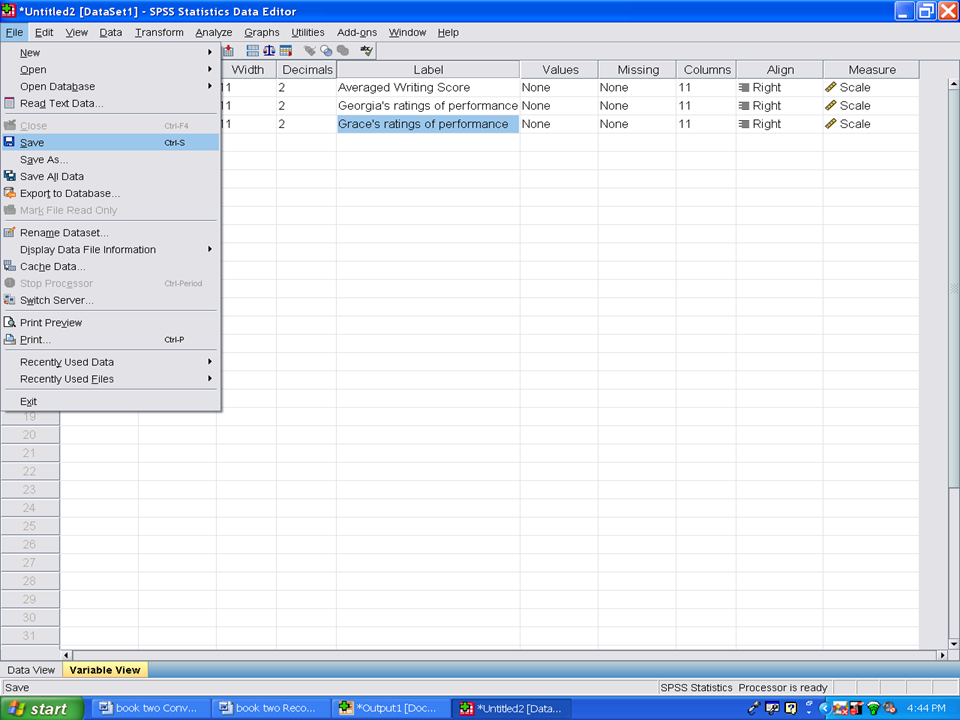
We have converted our Excel file into a SPSS dataset. Please save it prior to conducting any statistical analyses.
√ Click on File
√ Click on Save
Give it a name of your choosing and save it in a location that you will remember later.
Notification Switch
Would you like to follow the 'Calculating advanced statistics' conversation and receive update notifications?

|
|

|
|

|
|

|
|

|
|

|
|

|
|
|
|
|

|
|

|