

| << Chapter < Page | Chapter >> Page > |
Consider first Reaction (4) above, the decomposition of N 2 O 4 (g) to form NO 2 (g):
N 2 O 4 (g) → 2 NO 2 (g)
Following on our previous study of this reaction, we inject an initial amount of N 2 O 4 (g) into a 100 L reaction flask at 298 K. Now, however, we vary the initial number of moles of N 2 O 4 (g) in the flask and measure the equilibrium pressures of both the reactant and product gases. The results of a number of such studies are given in Table 1.
| Initial n(N 2 O 4 ) | P(N 2 O 4 ) (atm) | P(NO 2 ) (atm) |
| 0.1 | 0.00764 | 0.033627 |
| 0.5 | 0.07011 | 0.102517 |
| 1 | 0.166136 | 0.156806 |
| 1.5 | 0.26735 | 0.198917 |
| 2 | 0.371791 | 0.234574 |
| 2.5 | 0.478315 | 0.266065 |
| 3 | 0.586327 | 0.294578 |
| 3.5 | 0.695472 | 0.320827 |
| 4 | 0.805517 | 0.345277 |
| 4.5 | 0.916297 | 0.368255 |
| 5 | 1.027695 | 0.389998 |
The relationship between the pressures at equilibrium and the initial amount of N2O4 is perhaps more easily seen in a graph of the data in Table 1, as shown in Figure 1.
We might reasonably have predicted that the amount of NO2 produced at equilibrium would increase in direct proportion to increases in the amount of N2O4 we begin with. Table 1 shows that this is definitely not the case. Note that when we increase the initial
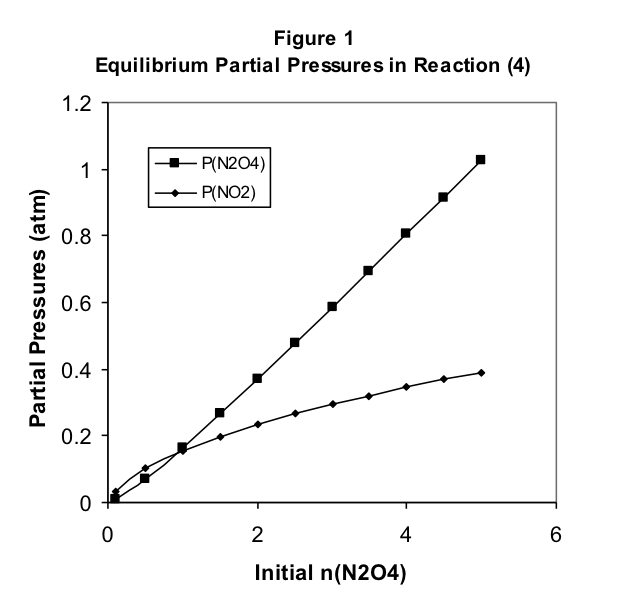
amount of N 2 O 4 by a factor of 10 from 0.5 moles to 5.0 moles, the pressure of NO 2 at equilibrium increases by a factor of less than 4.
There are some interesting observations here. Note that, when the initial amount of N 2 O 4 is less than 1 mole, the equilibrium pressure of NO 2 is greater than that of N 2 O 4 . These relative pressures reverse as the initial amount increases, with the N 2 O 4 equilibrium pressure keeping track with the initial amount but the NO 2 pressure falling short. Clearly, the equilibrium pressure of NO 2 does not increase proportionally with the initial amount of N 2 O 4 . In fact, the increase is slower than proportionality, suggesting perhaps a square root relationship between the pressure of NO 2 and the initial amount of N 2 O 4 .
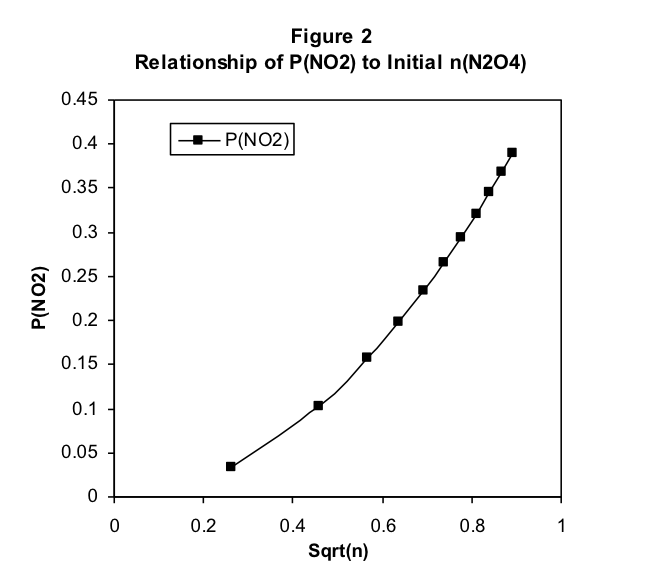
We test this in Figure 2 by plotting P(NO 2 ) at equilibrium versus the square root of the initial number of moles of N 2 O 4 . Figure 2 makes it clear that this is not a simple proportional relationship, but it is closer. Note in Figure 1 that the equilibrium pressure P(N 2 O 4 ) increases near proportionally with the initial amount of N 2 O 4 . This suggests plotting P(NO 2 ) versus the square root of P(N 2 O 4 ). This is done in Figure 3, where we discover that there is a very simple proportional relationship between the variables plotted in this way. We have thus observed that
where c is the slope of the graph. Equation (8) can be rewritten in a form that chemists standardly use, where c = K p :
To test the accuracy of this equation and to find the value of K p , we return to Table 1 and add another column in which we calculate the value of K p for each of the data points. Table 2 makes it clear that the “constant” in Equation 9 truly is independent of both the initial conditions and the equilibrium partial pressure of either one of the reactant or product. We thus refer to the constant K p in Equation 9 as the “reaction equilibrium constant.”
Notification Switch
Would you like to follow the 'Concept development studies in chemistry 2013' conversation and receive update notifications?

|
|

|
|

|
|

|
|

|
|

|
|

|
|

|
|

|
|

|