<< Chapter < Page Chapter >> Page >
The inverse filter approach to echo cancellation.

Deconvolution

The output of a linear time-invariant (LTI) system is the convolution of the input signal with the impulse response of the system. If the classroom is modeled as an LTI system, then the output echoed signal, y ( t ) MathType@MTEF@5@5@+= feaagGart1ev2aqatCvAUfeBSjuyZL2yd9gzLbvyNv2CaerbuLwBLnhiov2DGi1BTfMBaeXatLxBI9gBaerbd9wDYLwzYbItLDharqqtubsr 4rNCHbGeaGqiVu0Je9sqqrpepC0xbbL8F4rqqrFfpeea0xe9Lq=Jc9vqaqpepm0xbba9pwe9Q8fs0=yqaqpepae9pg0FirpepeKkFr0xfr=x fr=xb9adbaqaaeGaciGaaiaabeqaamaabaabaaGcbaGaamyEaiaacIcacaWG0bGaaiykaaaa@3946@ , is the convolution of the input signal, x ( t ) MathType@MTEF@5@5@+= feaagGart1ev2aqatCvAUfeBSjuyZL2yd9gzLbvyNv2CaerbuLwBLnhiov2DGi1BTfMBaeXatLxBI9gBaerbd9wDYLwzYbItLDharqqtubsr 4rNCHbGeaGqiVu0Je9sqqrpepC0xbbL8F4rqqrFfpeea0xe9Lq=Jc9vqaqpepm0xbba9pwe9Q8fs0=yqaqpepae9pg0FirpepeKkFr0xfr=x fr=xb9adbaqaaeGaciGaaiaabeqaamaabaabaaGcbaGaamiEaiaacIcacaWG0bGaaiykaaaa@3945@ , with the room's impulse response, h ( t ) MathType@MTEF@5@5@+= feaagGart1ev2aqatCvAUfeBSjuyZL2yd9gzLbvyNv2CaerbuLwBLnhiov2DGi1BTfMBaeXatLxBI9gBaerbd9wDYLwzYbItLDharqqtubsr 4rNCHbGeaGqiVu0Je9sqqrpepC0xbbL8F4rqqrFfpeea0xe9Lq=Jc9vqaqpepm0xbba9pwe9Q8fs0=yqaqpepae9pg0FirpepeKkFr0xfr=x fr=xb9adbaqaaeGaciGaaiaabeqaamaabaabaaGcbaGaamiAaiaacIcacaWG0bGaaiykaaaa@3935@ .

Block diagram of the echoic room as an LTI system with impulse response h ( t ) MathType@MTEF@5@5@+= feaagGart1ev2aqatCvAUfeBSjuyZL2yd9gzLbvyNv2CaerbuLwBLnhiov2DGi1BTfMBaeXatLxBI9gBaerbd9wDYLwzYbItLDharqqtubsr 4rNCHbGeaGqiVu0Je9sqqrpepC0xbbL8F4rqqrFfpeea0xe9Lq=Jc9vqaqpepm0xbba9pwe9Q8fs0=yqaqpepae9pg0FirpepeKkFr0xfr=x fr=xb9adbaqaaeGaciGaaiaabeqaamaabaabaaGcbaGaamiAaiaacIcacaWG0bGaaiykaaaa@3935@ where y ( t ) MathType@MTEF@5@5@+= feaagGart1ev2aqatCvAUfeBSjuyZL2yd9gzLbvyNv2CaerbuLwBLnhiov2DGi1BTfMBaeXatLxBI9gBaerbd9wDYLwzYbItLDharqqtubsr 4rNCHbGeaGqiVu0Je9sqqrpepC0xbbL8F4rqqrFfpeea0xe9Lq=Jc9vqaqpepm0xbba9pwe9Q8fs0=yqaqpepae9pg0FirpepeKkFr0xfr=x fr=xb9adbaqaaeGaciGaaiaabeqaamaabaabaaGcbaGaamyEaiaacIcacaWG0bGaaiykaaaa@3946@ is the echoed version of the input x ( t ) MathType@MTEF@5@5@+= feaagGart1ev2aqatCvAUfeBSjuyZL2yd9gzLbvyNv2CaerbuLwBLnhiov2DGi1BTfMBaeXatLxBI9gBaerbd9wDYLwzYbItLDharqqtubsr 4rNCHbGeaGqiVu0Je9sqqrpepC0xbbL8F4rqqrFfpeea0xe9Lq=Jc9vqaqpepm0xbba9pwe9Q8fs0=yqaqpepae9pg0FirpepeKkFr0xfr=x fr=xb9adbaqaaeGaciGaaiaabeqaamaabaabaaGcbaGaamiEaiaacIcacaWG0bGaaiykaaaa@3945@ .

The process of deconvolution involves designing an inverse filter ĥ(t) that is convolved with the echoed output signal to retrieve the original signal x ( t ) MathType@MTEF@5@5@+= feaagGart1ev2aqatCvAUfeBSjuyZL2yd9gzLbvyNv2CaerbuLwBLnhiov2DGi1BTfMBaeXatLxBI9gBaerbd9wDYLwzYbItLDharqqtubsr 4rNCHbGeaGqiVu0Je9sqqrpepC0xbbL8F4rqqrFfpeea0xe9Lq=Jc9vqaqpepm0xbba9pwe9Q8fs0=yqaqpepae9pg0FirpepeKkFr0xfr=x fr=xb9adbaqaaeGaciGaaiaabeqaamaabaabaaGcbaGaamiEaiaacIcacaWG0bGaaiykaaaa@3945@ . This can be done in either the time domain or frequency domain:

  • Time domain: Use the deconv() method in Matlab on the echoed signal and the impulse response of the classroom in order to extract the de-echoed signal.
  • Frequency domain: Take the Fast Fourier Transform (FFT) of both the impulse response of the room and the echoed signal. Point-wise divide the echoed signal by the transfer function, then take the inverse FFT of the result to extract the de-echoed signal.
Inputting the echoed signal into the inverse filter yields the de-echoed signal.

However in practice, the system adds noise to input signal, meaning that if the signal-to-noise ratio is too low, the inverse filter will yield a noisy signal that poorly approximates the input.

Finding the impulse response

A system is characterized at all frequencies by taking its impulse response . This is done by exciting a system with a Dirac delta function . The Dirac Delta Function is defined as:

δ ( x ) = { + , x = 0 0 , x 0 } MathType@MTEF@5@5@+= feaagGart1ev2aaatCvAUfeBSjuyZL2yd9gzLbvyNv2CaerbuLwBLnhiov2DGi1BTfMBaeXatLxBI9gBaerbd9wDYLwzYbItLDharqqtubsr 4rNCHbGeaGqiVu0Je9sqqrpepC0xbbL8F4rqqrFfpeea0xe9Lq=Jc9vqaqpepm0xbba9pwe9Q8fs0=yqaqpepae9pg0FirpepeKkFr0xfr=x fr=xb9adbaqaaeGaciGaaiaabeqaamaabaabaaGcbaaeaaaaaaaaa8qacqaH0oazcaGGOaGaamiEaiaacMcacqGH9aqpdaGadaqaauaabeqa ciaaaeaacqGHRaWkcqGHEisPcaGGSaaabaGaamiEaiabg2da9iaaicdaaeaacaaIWaGaaiilaaqaaiaadIhacqGHGjsUcaaIWaaaaaGaay5E aiaaw2haaaaa@47FF@
δ ( x ) d x = 1 MathType@MTEF@5@5@+= feaagGart1ev2aaatCvAUfeBSjuyZL2yd9gzLbvyNv2CaerbuLwBLnhiov2DGi1BTfMBaeXatLxBI9gBaerbd9wDYLwzYbItLDharqqtubsr 4rNCHbGeaGqiVu0Je9sqqrpepC0xbbL8F4rqqrFfpeea0xe9Lq=Jc9vqaqpepm0xbba9pwe9Q8fs0=yqaqpepae9pg0FirpepeKkFr0xfr=x fr=xb9adbaqaaeGaciGaaiaabeqaamaabaabaaGcbaWaa8qCaeaacqaH0oazcaGGOaGaamiEaiaacMcacaWGKbGaamiEaiabg2da9iaaigda aSqaaiabgkHiTiabg6HiLcqaaiabg6HiLcqdcqGHRiI8aaaa@43CF@
The Dirac Delta Function is a distribution that is infinitely tall and infinitely narrow at 0, and the area under the Dirac Delta Function is defined to be 1.

However, it is practically impossible to excite a room with the ideal Dirac Delta function. Consequently, we used three methods to approximate the room's impulse response:

  • Balloon Pop: filling a latex balloon with air and bursting it.
  • Pseudo Dirac: using the dirac() function in Matlab to generate a vector of zeros with a single one in the center, then playing it using the sound() function.
  • Sine-sweep Method:
    1. Generate a logarithmically increasing sine signal over a desired frequency range (20 Hz to 20 KHz for this application)
    2. Create an inverse chirp filter that time reverses the chirp and shifts it to become a causal signal (so that it exists in positive time). Then, divide the magnitude of the spectrum of the inverse filter by the square of the magnitude of the spectrum of the chirp signal.
    The time shift inverts the phase of the chirp leading to linear phase after the convolution and the second set of operations neutralizes the squaring of the magnitude of the spectrum caused by the convolution.
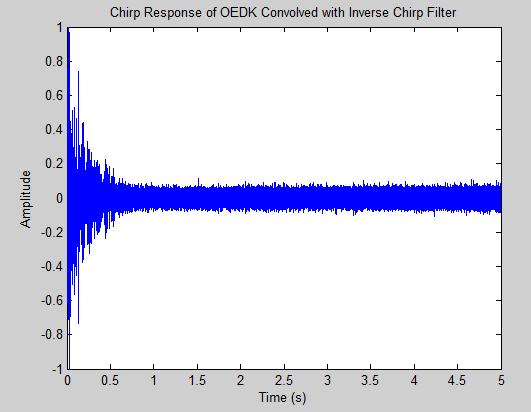
    • Convolve the chirp response of the room with the inverse chirp filter to get the impulse response of the room.

    This logarithmically increasing sine signal can be characterized in the time domain by the following equation:

    x ( t ) = sin [ T ω 1 ln ( ω 2 ω 1 ) ( e t T ln ( ω 2 ω 1 ) 1 ) ] MathType@MTEF@5@5@+= feaagGart1ev2aaatCvAUfeBSjuyZL2yd9gzLbvyNv2CaerbuLwBLnhiov2DGi1BTfMBaeXatLxBI9gBaerbd9wDYLwzYbItLDharqqtubsr 4rNCHbGeaGqiVu0Je9sqqrpepC0xbbL8F4rqqrFfpeea0xe9Lq=Jc9vqaqpepm0xbba9pwe9Q8fs0=yqaqpepae9pg0FirpepeKkFr0xfr=x fr=xb9adbaqaaeGaciGaaiaabeqaamaabaabaaGcbaGaamiEaiaacIcacaWG0bGaaiykaiabg2da9iGacohacaGGPbGaaiOBamaadmaabaWa aubiaeqaleqabaWaaeWaaeaacaWGLbWaaWbaaWqabeaadaWcbaqaaiaadshaaeaacaWGubaaaiGacYgacaGGUbGaaiikamaaleaabaGaeqyY dC3aaSbaaeaacaaIYaaabeaaaeaacqaHjpWDdaWgaaqaaiaaigdaaeqaaaaacaGGPaaaaSGaeyOeI0IaaGymaaGaayjkaiaawMcaaaqdbaWaaSqaa4qaaiaadsfacqaHjpWDdaWgaaqaaiaaigdaaeqaaaqaaiGacY gacaGGUbGaaiikamaaleaabaGaeqyYdC3aaSbaaeaacaaIYaaabeaaaeaacqaHjpWDdaWgaaqaaiaaigdaaeqaaaaacaGGPaaaaaaaaOGaay 5waiaaw2faaaaa@5A8E@

    where ω 1 MathType@MTEF@5@5@+= feaagGart1ev2aqatCvAUfeBSjuyZL2yd9gzLbvyNv2CaerbuLwBLnhiov2DGi1BTfMBaeXatLxBI9gBaerbd9wDYLwzYbItLDharqqtubsr 4rNCHbGeaGqiVu0Je9sqqrpepC0xbbL8F4rqqrFfpeea0xe9Lq=Jc9vqaqpepm0xbba9pwe9Q8fs0=yqaqpepae9pg0FirpepeKkFr0xfr=x fr=xb9adbaqaaeGaciGaaiaabeqaamaabaabaaGcbaGaeqyYdC3aaSbaaSqaaiaaigdaaeqaaaaa@38AA@ is the initial radian frequency and ω 2 MathType@MTEF@5@5@+= feaagGart1ev2aqatCvAUfeBSjuyZL2yd9gzLbvyNv2CaerbuLwBLnhiov2DGi1BTfMBaeXatLxBI9gBaerbd9wDYLwzYbItLDharqqtubsr 4rNCHbGeaGqiVu0Je9sqqrpepC0xbbL8F4rqqrFfpeea0xe9Lq=Jc9vqaqpepm0xbba9pwe9Q8fs0=yqaqpepae9pg0FirpepeKkFr0xfr=x fr=xb9adbaqaaeGaciGaaiaabeqaamaabaabaaGcbaGaeqyYdC3aaSbaaSqaaiaaikdaaeqaaaaa@38AB@ is the final radian frequency of the sweep of duration T .

Sine sweep

The impulse response of the classroom is gleaned from the convolution of the room's response to the logarithmically increasing sine signal with the pre-calculated inverse chirp filter.

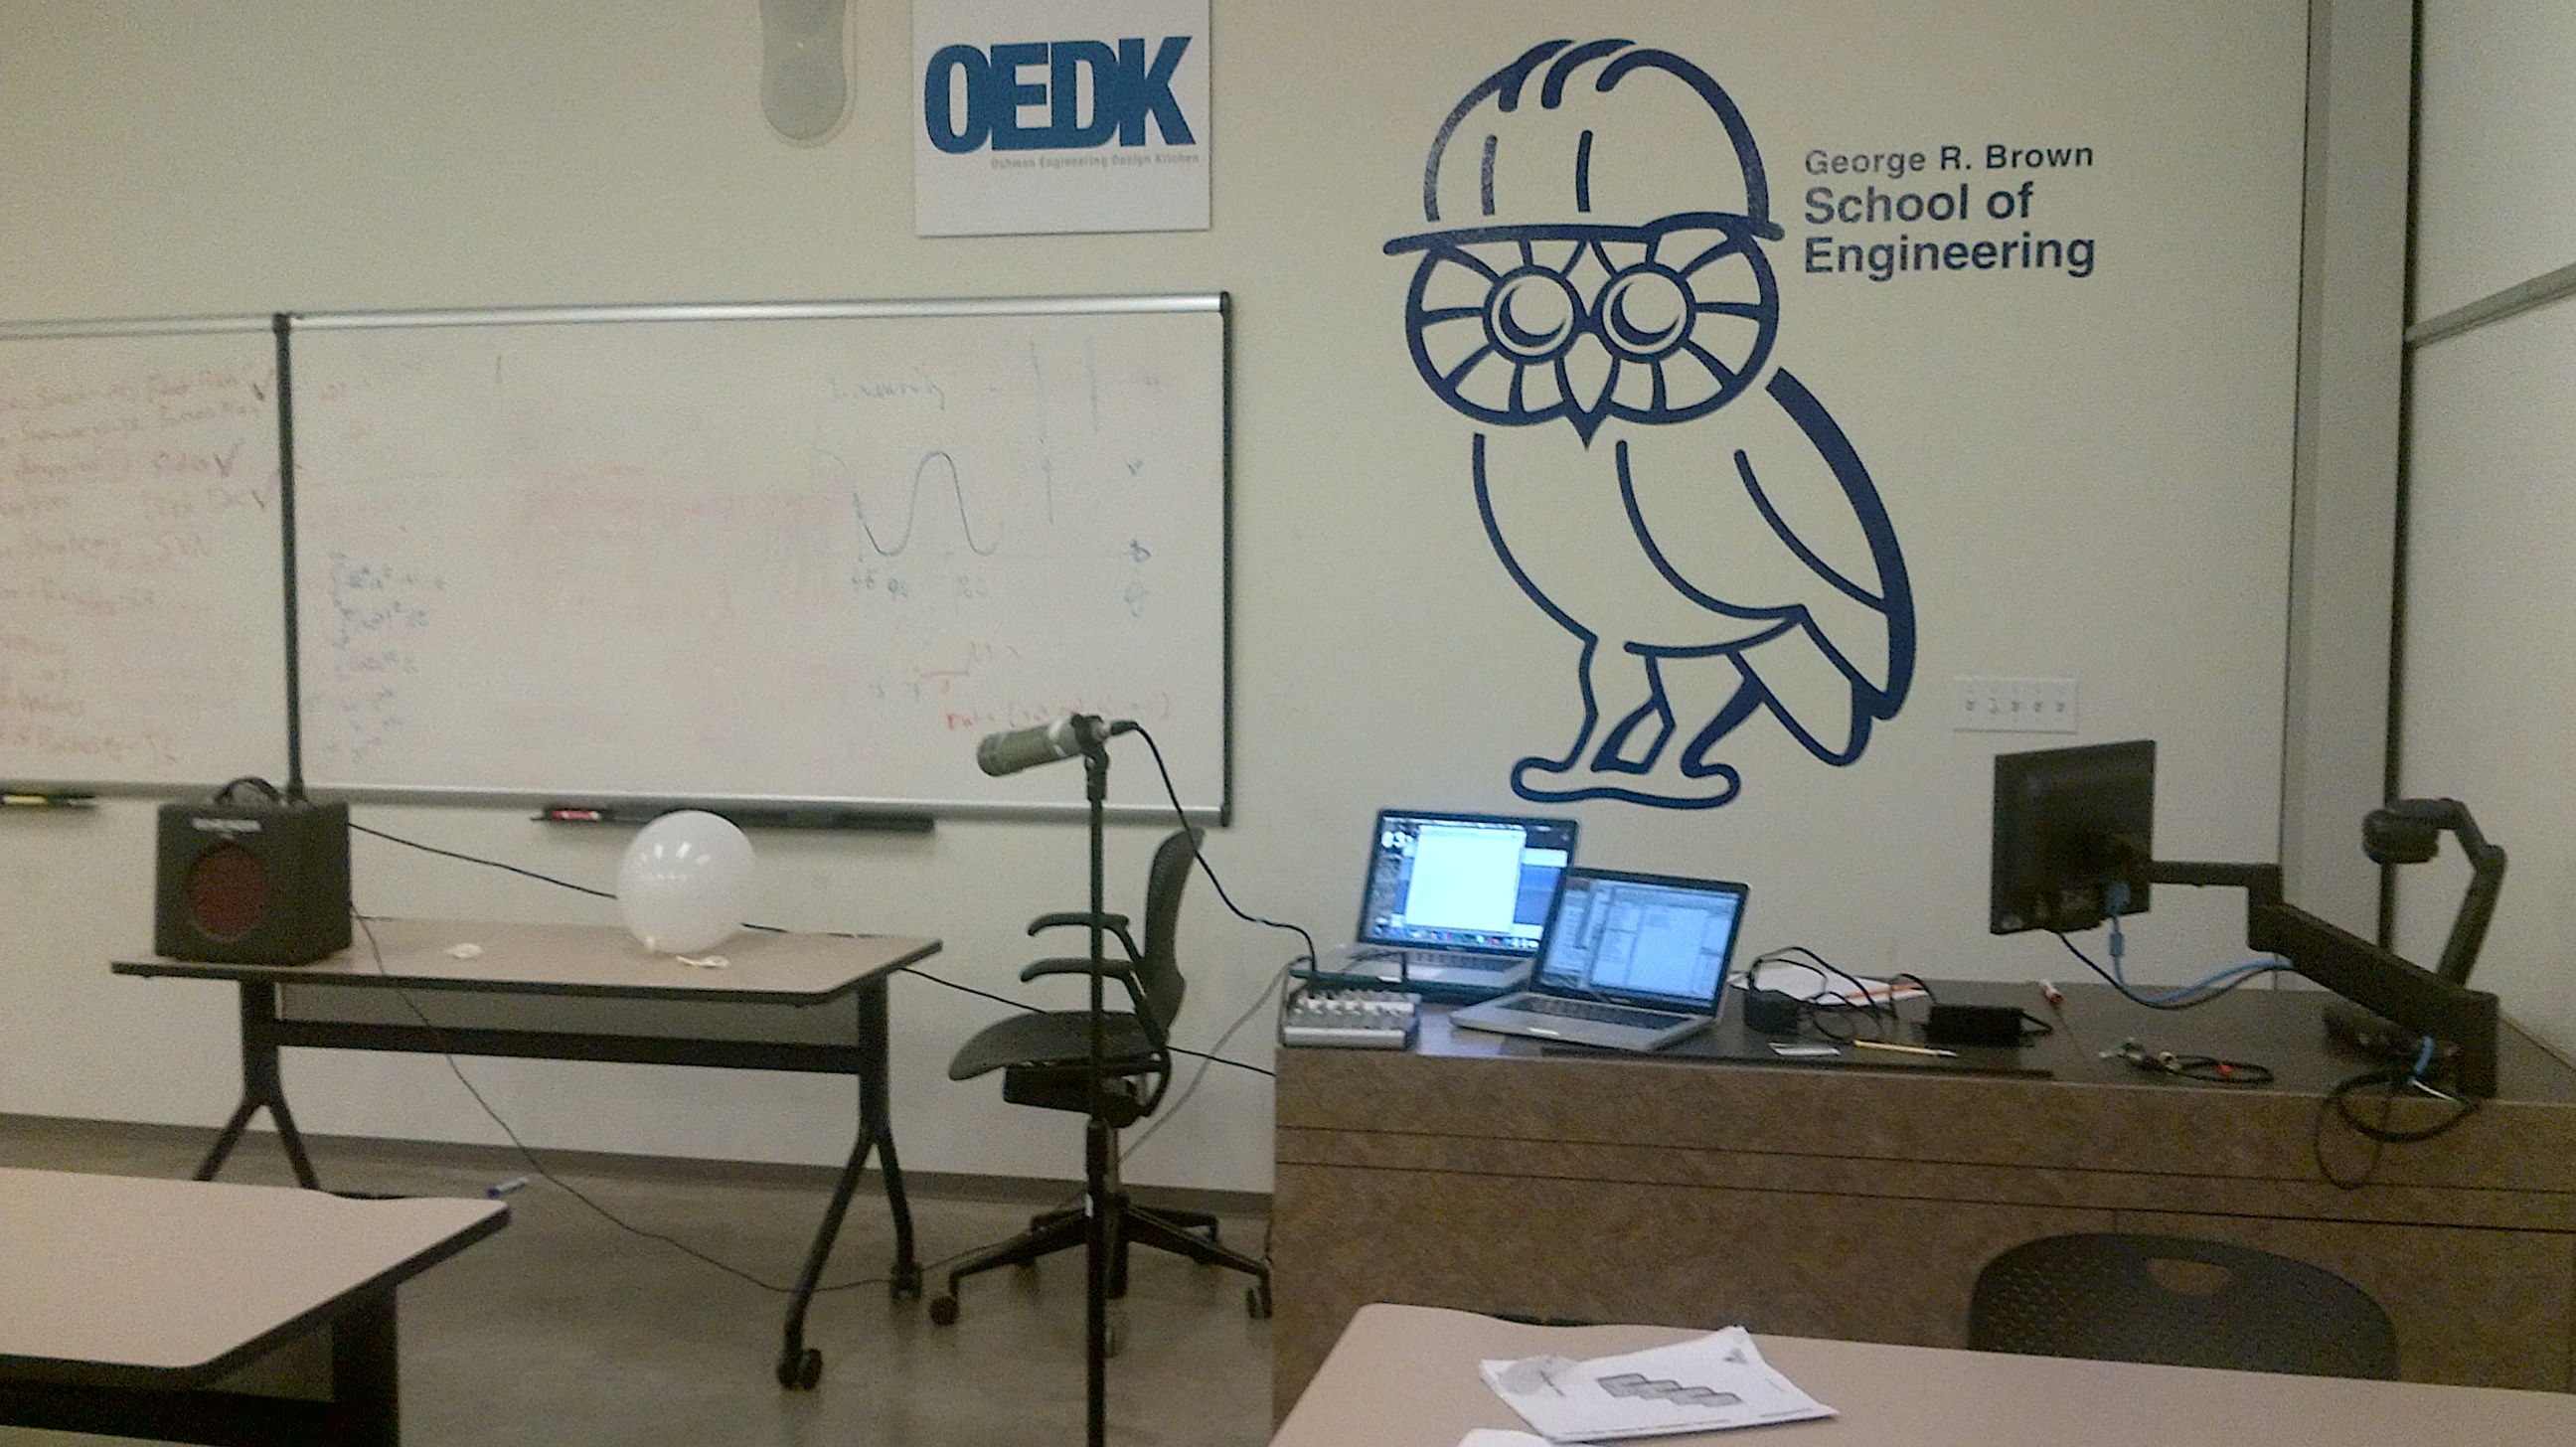
To measure the response, we used:

  • A small guitar amplifier with a relatively flat response facing the desks
  • A directional cardioid microphone 2 meters from the amplifier at a thirty degree angle
  • A microphone preamplifier
  • An Apple Macbook Pro Laptop using Audacity for recording
Our equipment setup in the OEDK classroom. The microphone is placed in the same location used for recording presentations.

Problems

Several factors make this model unrealistic:

  • Realistically, speakers move around and face different directions when they move. Our impulse responses are highly specific to the position of the signal's source. The information we get is based on the amplifier being stationary and facing a single direction.
  • The impulse response is also time-varying. If even one person leaves, the average absorption coefficient of all the objects in the room changes and, per the Sabine equation, the reverberation time of the room also changes. People and objects are continually shifting, constantly affecting how the sound reflects around the room.

Time-varying adaptive filters are more sensible for problems such as suppressing reverberations in the OEDK classroom.

Questions & Answers

what is biology
Hajah Reply
the study of living organisms and their interactions with one another and their environments
AI-Robot
what is biology
Victoria Reply
HOW CAN MAN ORGAN FUNCTION
Alfred Reply
the diagram of the digestive system
Assiatu Reply
allimentary cannel
Ogenrwot
How does twins formed
William Reply
They formed in two ways first when one sperm and one egg are splited by mitosis or two sperm and two eggs join together
Oluwatobi
what is genetics
Josephine Reply
Genetics is the study of heredity
Misack
how does twins formed?
Misack
What is manual
Hassan Reply
discuss biological phenomenon and provide pieces of evidence to show that it was responsible for the formation of eukaryotic organelles
Joseph Reply
what is biology
Yousuf Reply
the study of living organisms and their interactions with one another and their environment.
Wine
discuss the biological phenomenon and provide pieces of evidence to show that it was responsible for the formation of eukaryotic organelles in an essay form
Joseph Reply
what is the blood cells
Shaker Reply
list any five characteristics of the blood cells
Shaker
lack electricity and its more savely than electronic microscope because its naturally by using of light
Abdullahi Reply
advantage of electronic microscope is easily and clearly while disadvantage is dangerous because its electronic. advantage of light microscope is savely and naturally by sun while disadvantage is not easily,means its not sharp and not clear
Abdullahi
cell theory state that every organisms composed of one or more cell,cell is the basic unit of life
Abdullahi
is like gone fail us
DENG
cells is the basic structure and functions of all living things
Ramadan
What is classification
ISCONT Reply
is organisms that are similar into groups called tara
Yamosa
in what situation (s) would be the use of a scanning electron microscope be ideal and why?
Kenna Reply
A scanning electron microscope (SEM) is ideal for situations requiring high-resolution imaging of surfaces. It is commonly used in materials science, biology, and geology to examine the topography and composition of samples at a nanoscale level. SEM is particularly useful for studying fine details,
Hilary
cell is the building block of life.
Condoleezza Reply
Got questions? Join the online conversation and get instant answers!
Jobilize.com Reply

Get Jobilize Job Search Mobile App in your pocket Now!

Get it on Google Play Download on the App Store Now


Source:  OpenStax, Characterization and application of echo cancellation methods. OpenStax CNX. Dec 17, 2012 Download for free at http://cnx.org/content/col11468/1.3
Google Play and the Google Play logo are trademarks of Google Inc.

Notification Switch

Would you like to follow the 'Characterization and application of echo cancellation methods' conversation and receive update notifications?

Ask