<< Chapter < Page Chapter >> Page >

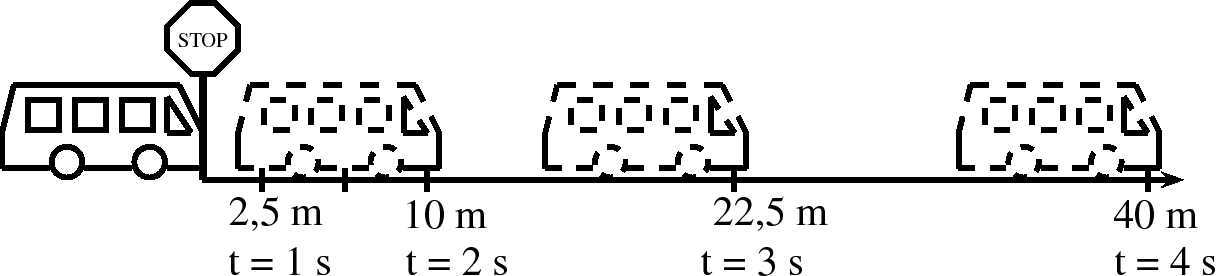
To calculate the velocity of the taxi you need to calculate the gradient of the line at each second:

v 1 s = Δ x Δ t = x f - x i t f - t i = 5 m - 0 m 1 , 5 s - 0 , 5 s = 5 m · s - 1
v 2 s = Δ x Δ t = x f - x i t f - t i = 15 m - 5 m 2 , 5 s - 1 , 5 s = 10 m · s - 1
v 3 s = Δ x Δ t = x f - x i t f - t i = 30 m - 15 m 3 , 5 s - 2 , 5 s = 15 m · s - 1

From these velocities, we can draw the velocity-time graph which forms a straight line.

The acceleration is the gradient of the v vs. t graph and can be calculated as follows:

a = Δ v Δ t = v f - v i t f - t i = 15 m · s - 1 - 5 m · s - 1 3 s - 1 s = 5 m · s - 2

The acceleration does not change during the motion (the gradient stays constant). This is motion at constant or uniform acceleration.

The graphs for this situation are shown in [link] .

Graphs for motion with a constant acceleration (a) position vs. time (b) velocity vs. time (c) acceleration vs. time.

Velocity from acceleration vs. time graphs

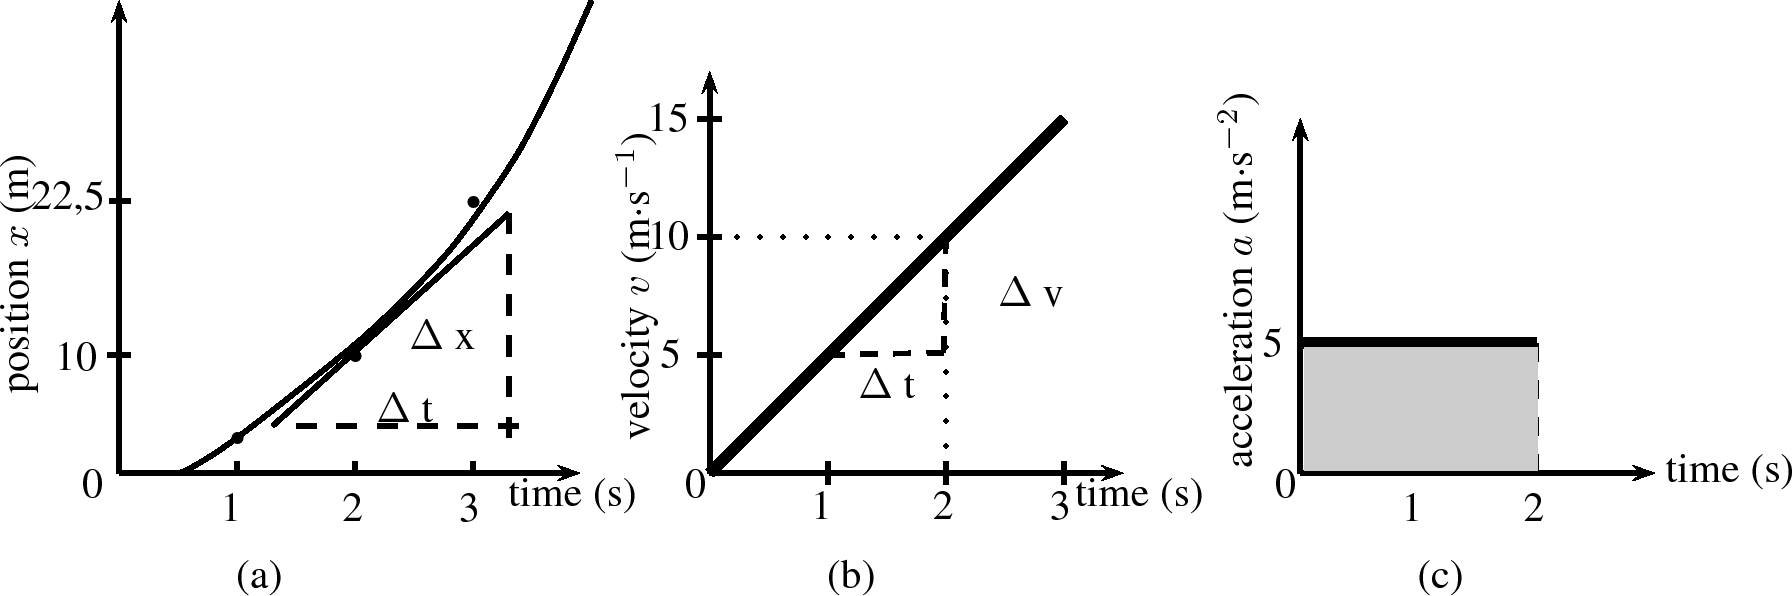
Just as we used velocity vs. time graphs to find displacement, we can use acceleration vs. time graphs to find the velocity of an object at a given moment in time. We simply calculate the area under the acceleration vs. time graph, at a given time. In the graph below, showing an object at a constant positive acceleration, the increase in velocity of the object after 2 seconds corresponds to the shaded portion.

v = area of rectangle = a × Δ t = 5 m · s - 2 × 2 s = 10 m · s - 1

The velocity of the object at t = 2 s is therefore 10 m · s - 1 . This corresponds with the values obtained in [link] .

Summary of graphs

The relation between graphs of position, velocity and acceleration as functions of time is summarised in [link] .

Position-time, velocity-time and acceleration-time graphs.

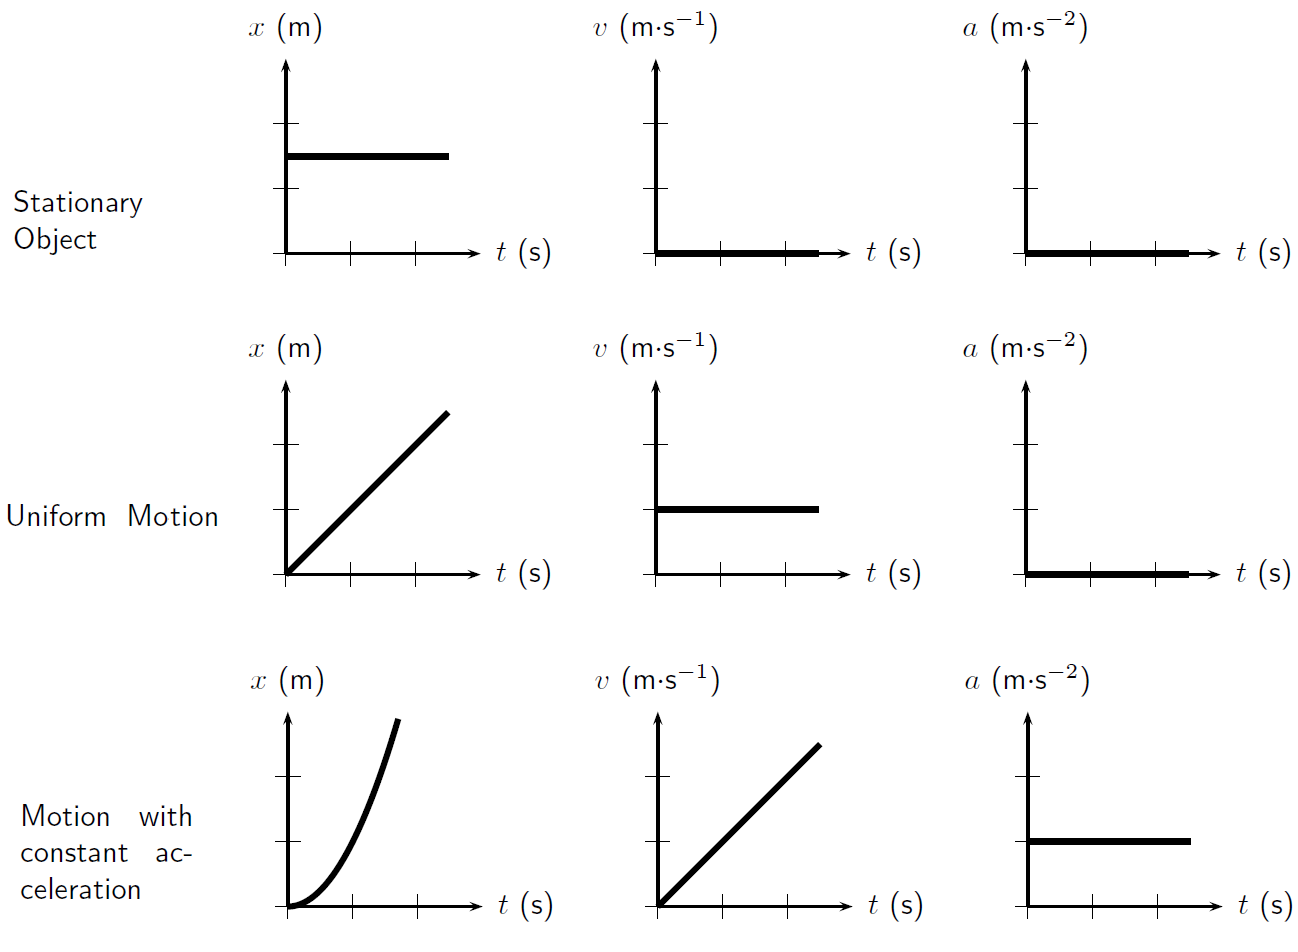
Often you will be required to describe the motion of an object that is presented as a graph of either position, velocity or acceleration as functions of time. The description of the motion represented by a graph should include the following (where possible):

  1. whether the object is moving in the positive or negative direction
  2. whether the object is at rest, moving at constant velocity or moving at constant positive acceleration (speeding up) or constant negative acceleration (slowing down)

You will also often be required to draw graphs based on a description of the motion in words or from a diagram. Remember that these are just different methods of presenting the same information. If you keep in mind the general shapes of the graphs for the different types of motion, there should not be any difficulty with explaining what is happening.

Experiment: position versus time using a ticker timer

Aim:

To measure the position and time during motion and to use that data to plot a “Position vs. Time" graph.

Apparatus:

Trolley, ticker tape apparatus, tape, graph paper, ruler, ramp

Method:

  1. Work with a friend. Copy the table below into your workbook.
  2. Attach a length of tape to the trolley.
  3. Run the other end of the tape through the ticker timer.
  4. Start the ticker timer going and roll the trolley down the ramp.
  5. Repeat steps 1 - 3.
  6. On each piece of tape, measure the distance between successive dots. Note these distances in the table below.
  7. Use the frequency of the ticker timer to work out the time intervals between successive dots. Note these times in the table below,
  8. Work out the average values for distance and time.
  9. Use the average distance and average time values to plot a graph of “Distance vs. Time" onto graph paper . Stick the graph paper into your workbook. (Remember that “A vs. B" always means “y vs. x").
  10. Insert all axis labels and units onto your graph.
  11. Draw the best straight line through your data points.

Questions & Answers

what is biology
Hajah Reply
the study of living organisms and their interactions with one another and their environments
AI-Robot
what is biology
Victoria Reply
HOW CAN MAN ORGAN FUNCTION
Alfred Reply
the diagram of the digestive system
Assiatu Reply
allimentary cannel
Ogenrwot
How does twins formed
William Reply
They formed in two ways first when one sperm and one egg are splited by mitosis or two sperm and two eggs join together
Oluwatobi
what is genetics
Josephine Reply
Genetics is the study of heredity
Misack
how does twins formed?
Misack
What is manual
Hassan Reply
discuss biological phenomenon and provide pieces of evidence to show that it was responsible for the formation of eukaryotic organelles
Joseph Reply
what is biology
Yousuf Reply
the study of living organisms and their interactions with one another and their environment.
Wine
discuss the biological phenomenon and provide pieces of evidence to show that it was responsible for the formation of eukaryotic organelles in an essay form
Joseph Reply
what is the blood cells
Shaker Reply
list any five characteristics of the blood cells
Shaker
lack electricity and its more savely than electronic microscope because its naturally by using of light
Abdullahi Reply
advantage of electronic microscope is easily and clearly while disadvantage is dangerous because its electronic. advantage of light microscope is savely and naturally by sun while disadvantage is not easily,means its not sharp and not clear
Abdullahi
cell theory state that every organisms composed of one or more cell,cell is the basic unit of life
Abdullahi
is like gone fail us
DENG
cells is the basic structure and functions of all living things
Ramadan
What is classification
ISCONT Reply
is organisms that are similar into groups called tara
Yamosa
in what situation (s) would be the use of a scanning electron microscope be ideal and why?
Kenna Reply
A scanning electron microscope (SEM) is ideal for situations requiring high-resolution imaging of surfaces. It is commonly used in materials science, biology, and geology to examine the topography and composition of samples at a nanoscale level. SEM is particularly useful for studying fine details,
Hilary
cell is the building block of life.
Condoleezza Reply
Got questions? Join the online conversation and get instant answers!
Jobilize.com Reply

Get Jobilize Job Search Mobile App in your pocket Now!

Get it on Google Play Download on the App Store Now


Source:  OpenStax, Physics - grade 10 [caps 2011]. OpenStax CNX. Jun 14, 2011 Download for free at http://cnx.org/content/col11298/1.3
Google Play and the Google Play logo are trademarks of Google Inc.

Notification Switch

Would you like to follow the 'Physics - grade 10 [caps 2011]' conversation and receive update notifications?

Ask